
Software per il miglioramento continuo e la produzione snella
Il miglioramento continuo dà i suoi frutti solo quando ogni cambiamento viene misurato. Accevo collega i vostri macchinari, rileva automaticamente ogni perdita e mette i team Lean, Kaizen e Six Sigma a disposizione degli stessi dati in tempo reale: in questo modo, le idee di miglioramento si trasformano in risultati concreti anziché rimanere semplici buone intenzioni.
Un'unica piattaforma per il miglioramento dell'OEE, l'analisi dei microarresti e dei tempi di fermo, la documentazione digitale e il monitoraggio in tempo reale – utilizzata sulle linee di produzione nei settori dei beni di largo consumo (FMCG), farmaceutico, del tabacco e della produzione discreta.
Che cos’è il miglioramento continuo nella produzione?
Miglioramento continuo è il processo continuo di apportare modifiche incrementali a prodotti, servizi, processi o sistemi al fine di migliorare la qualità, aumentare l’efficienza e ridurre al minimo i costi. Nel settore manifatturiero non si tratta di un progetto con una data di conclusione, bensì di una routine: osservare ciò che accade effettivamente sulla linea di produzione, individuare la perdita maggiore, apportare una modifica, verificare se ha funzionato e, in caso affermativo, standardizzarla.
Quella routine è la Ciclo PDCA – Pianificare, Eseguire, Verificare, Agire – ed è proprio qui che la maggior parte dei programmi di miglioramento fallisce. Non a Piano, dove le idee non mancano mai, ma a Verifica. Senza dati affidabili sulla produzione, nessuno può dimostrare che il cambiamento abbia fatto la differenza, quindi il nuovo standard non prende mai piede e la perdita ritorna silenziosamente tre mesi dopo.
Quella routine è la Ciclo PDCA – Pianificare, Eseguire, Verificare, Agire – ed è proprio qui che la maggior parte dei programmi di miglioramento fallisce. Non a Piano, dove le idee non mancano mai, ma a Verifica. Senza dati affidabili sulla produzione, nessuno può dimostrare che il cambiamento abbia fatto la differenza, quindi il nuovo standard non prende mai piede e la perdita ritorna silenziosamente tre mesi dopo.
Principali metodologie di miglioramento continuo
Lean e Kaizen
Lean Manufacturing – eliminare gli otto sprechi e favorire il flusso di valore. Il software per la produzione snella rende visibili gli sprechi nel giro di poche ore, anziché durante un workshop annuale sul flusso di valore.
Kaizen – piccoli miglioramenti, apportati costantemente da chi svolge il lavoro. Il software Kaizen registra l’idea, l’azione e il risultato misurato, in modo che i progressi non vadano persi al cambio di turno.
5S e mappatura del flusso di valore – un ambiente di lavoro ben organizzato e un flusso di lavoro ben definito. Gli audit digitali e i dati reali sui tempi di ciclo sostituiscono il giro con il blocco per appunti e la stima con il cronometro.
Six Sigma e risoluzione strutturata dei problemi
Six Sigma – ridurre la variabilità fino a quando i difetti non diventano statisticamente rari. Le carte di controllo SPC e Shewhart, elaborate sulla base dei valori reali del processo, evidenziano la deriva molto prima che questa si traduca in scarti.
DMAIC – Definire, misurare, analizzare, migliorare, controllare. L’efficacia delle fasi di misurazione e controllo dipende interamente dalla qualità del sistema di misurazione su cui si basano.
PDCA e analisi delle cause profonde – il ciclo di miglioramento stesso, con i “5 perché” e l’analisi a lisca di pesce basati sul registro degli eventi effettivi piuttosto che su ciò che le persone ricordano di martedì scorso.
Attrezzature e procedure operative in officina
OEE – Disponibilità × Prestazioni × Qualità: l’unico dato che indica in che misura la capacità teorica viene effettivamente convertita in prodotto di qualità.
TPM – La Manutenzione Produttiva Totale (TPM) affida alla linea di produzione la responsabilità delle condizioni delle attrezzature, con il supporto di liste di controllo per la manutenzione autonoma e dati sull’affidabilità.
Gemba walk e Andon – vai a controllare e fai in modo che la linea chiami aiuto nel momento in cui ne ha bisogno. Digital Andon inoltra la richiesta e registra il tempo impiegato per la risposta.
Il miglioramento continuo sulla lavagna bianca rispetto al miglioramento continuo basato sui dati
La maggior parte dei programmi di miglioramento si basa su un registro dei tempi di inattività compilato a mano, su un rapporto di turno redatto al computer la mattina seguente e su un foglio di calcolo di cui nessuno si fida completamente. I brevi arresti non vengono mai registrati, le cause vengono attribuite a memoria ore dopo l’evento ed è impossibile isolare l’effetto della modifica apportata il mese scorso da tutto il resto che è accaduto.
Migliorare senza un sistema:
- I tempi di inattività registrati a mano: le microinterruzioni e le riduzioni di velocità non vengono mai registrate
- Cause alla radice individuate a memoria alla fine del turno, non al momento dell'arresto
- Le idee e le azioni Kaizen registrate nei fogli di calcolo vanno perse al momento del passaggio di consegne e poi di nuovo a fine anno
- Non essendoci un confronto “prima e dopo” attendibile, i cambiamenti che hanno dato buoni risultati non diventano mai il nuovo standard
Grazie al flusso automatico dei dati delle macchine, la perdita viene visualizzata sullo schermo mentre il turno è ancora in corso. Il team di miglioramento discute su come risolvere il problema anziché sul fatto che il dato sia corretto, e la fase di verifica del ciclo PDCA richiede pochi minuti anziché un mese.
Migliorare grazie a un software di miglioramento continuo:
- Ogni fermata viene registrata automaticamente dal PLC, fino alle microfermate di pochi secondi
- Perdite classificate e ordinate per te, con diagrammi di Pareto e un albero delle perdite OEE
- Azioni, responsabili e scadenze monitorate in relazione alla perdita specifica che dovevano eliminare
- Misurazioni “prima e dopo” relative a OEE, scarti e tempo di ciclo: la prova che il cambiamento ha effettivamente funzionato
~10%
Aumento tipico dell'OEE sulle linee di produzione collegate
5 s
microstop più breve rilevato automaticamente
-30%
riduzione del tempo dedicato alla rendicontazione manuale della produzione
24/7
live visibility of every line, shift and site
Accevo continuous improvement tools
Six modules that give an improvement team the three things a whiteboard cannot: data it can trust, standards people actually follow, and proof that the change worked. Each runs on the one Accevo Smart Factory platform, so you can start with a single bottleneck line and add capability – up to a full Sistema di esecuzione della produzione – without replacing what you already run.
Measurement Explorer (MEX)
A built-in industrial data historian that records time-series data from PLCs, sensors, SCADA systems and manual entry in one archive. Trend any process parameter against output, energy or quality over any period – the analytical backbone for Six Sigma and root cause analysis.

Monitoraggio delle microfermate
Detects the short, repeated interruptions no operator would ever write down, measures them precisely and locates the bottleneck causing them. On fast packaging and assembly lines this is usually the single largest hidden loss in the plant.

Produzione senza carta
Replaces forms and binders with digital documents and step-by-step operator guidance. The standard is delivered at the panel in the context of the current order, followed in sequence, and updated everywhere at once the moment it changes.

Quality & LIMS
Samples, tests and results managed digitally and tied back to the batch, machine and shift that produced them. Lab data stops being an island: an out-of-spec result points straight at the process conditions behind it.

Machine control & changeovers
Uploads programs, recipes and setpoints to machines automatically. Cuts launch and changeover time, and removes the setting errors that quietly generate scrap for the first hour of every run.

Riunioni interattive
Turns the shift whiteboard into a touchscreen dashboard fed by live data. Daily management, SQCDP boards and Gemba reviews all run on the numbers the line is producing right now, and actions are captured in the room.
OEE improvement: find the loss before you try to fix it
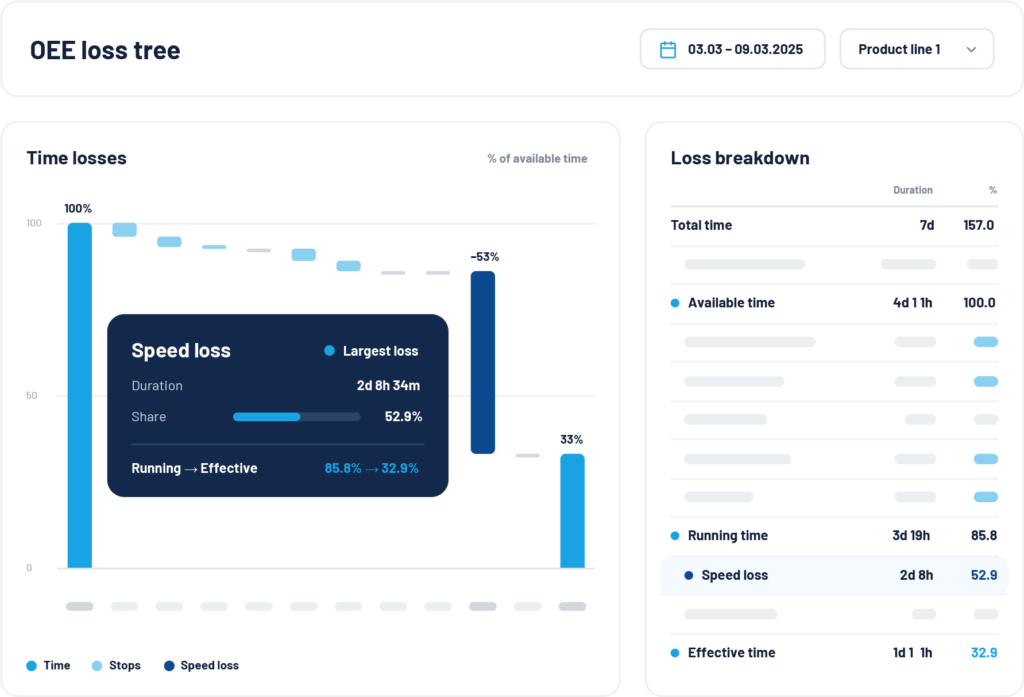
OEE – Availability x Performance x Quality – is the most useful single number in continuous improvement and the most commonly misused. A monthly OEE figure calculated from operator logs tells you the plant lost time. It does not tell you where, when, or to what. Accevo calculates OEE continuously from machine signals and keeps breaking it apart until every lost minute has a name and an owner.
Availability, Performance and Quality, calculated live
Machine states, cycle counts and reject counts come straight from the controller, so all three factors are computed as production runs – per machine, per shift, per product, per crew. No end-of-shift reconstruction, no rounding, and no argument about the baseline before the improvement even starts.
The Six Big Losses and the OEE loss tree
Every lost minute lands on a loss tree: breakdowns and setups under Availability, microstops and reduced speed under Performance, scrap and rework under Quality. Pareto charts rank the causes by cost, so the improvement team works on the biggest loss rather than the loudest one.
Benchmarking across lines, shifts and sites
The same product on two lines, or the same line on two shifts, rarely performs the same. Comparable OEE across assets makes that gap visible and turns your own best-performing shift into the standard everyone else can be held to.
Microstops and downtime analysis
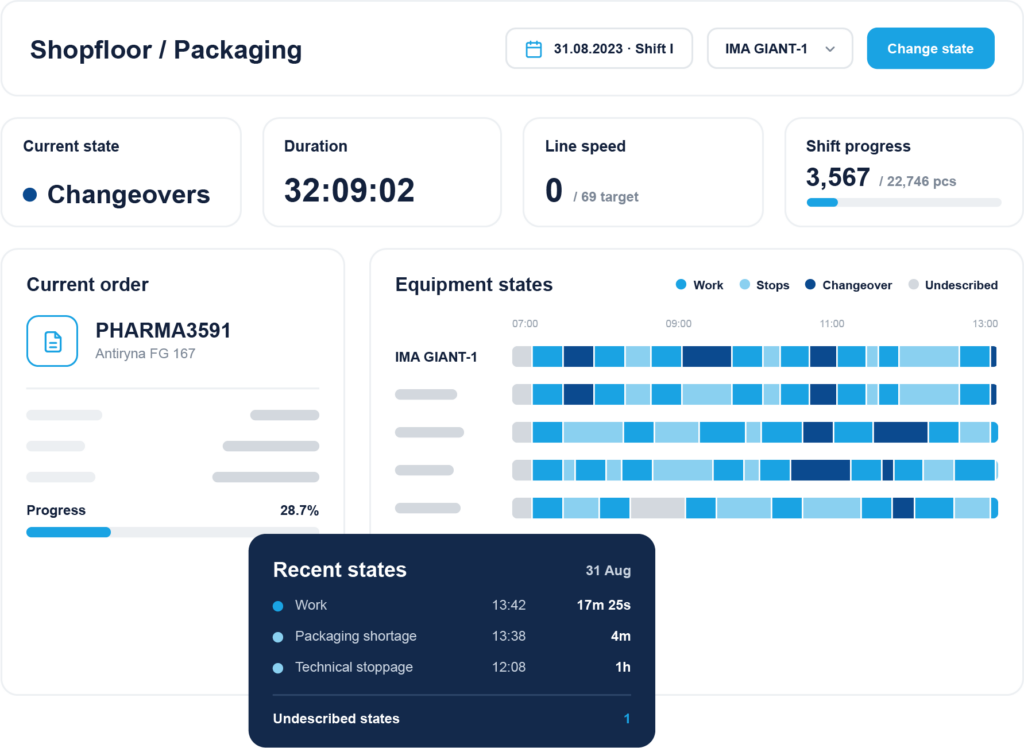
A five-second stop is invisible. Two hundred of them in a shift is an hour of lost production that appears in no report at all. Microstops are the classic hidden loss – too short to log by hand, too frequent to ignore, and almost always the reason a line runs below rated speed while the downtime board looks perfectly clean.
Automatic detection at the source
Stops are read directly from PLC signals – Siemens, Allen-Bradley, Mitsubishi, OPC UA, Modbus TCP – and timestamped to the second. Nothing depends on an operator noticing, remembering or having a free hand.
Root cause, not just a stop log
Repeated stops are grouped and correlated across machines, shifts, products and time of day, so the pattern behind them surfaces: a specific format change, a particular material lot, the third hour of the night shift.
Pareto ranking and action tracking
Causes are ranked by total minutes lost and turned into a prioritised improvement list, with an owner and a deadline attached – and the effect re-measured once the fix is in place.
Paperless production and digital documentation
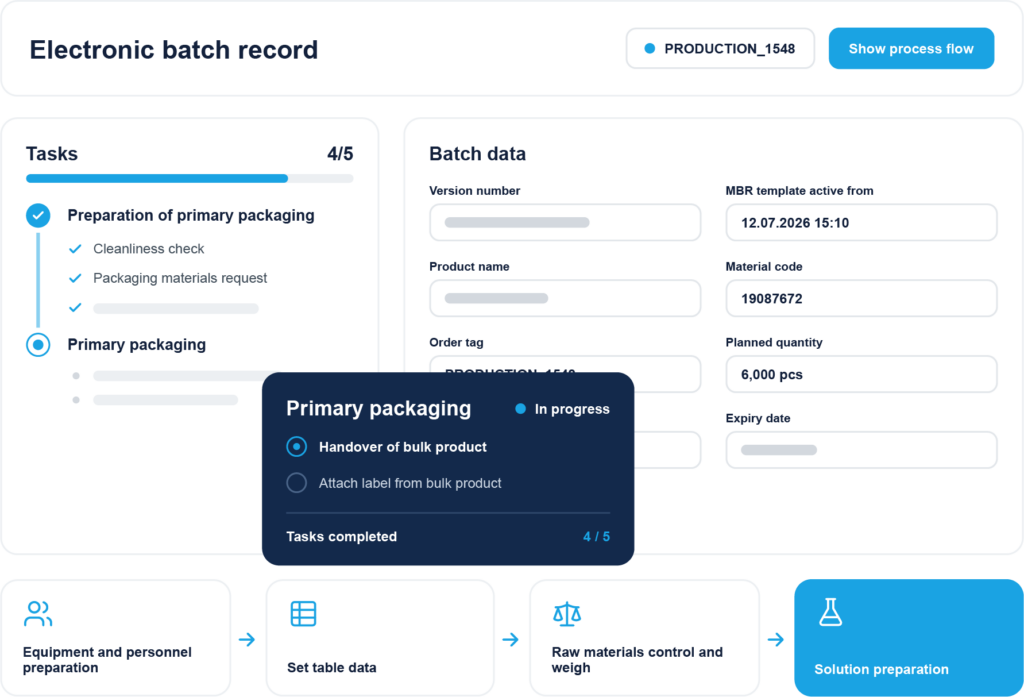
Continuous improvement produces standards, and a standard that lives in a binder is a standard nobody follows. Going senza carta is what makes an improvement stick: the new method reaches every operator on every shift the moment it is approved, and the system records that it was actually followed.
Digital SOPs and work instructions
Procedures, drawings, photos and video delivered at the operator panel in the context of the current order. Update once and the previous revision disappears from the shop floor immediately.
Moduli elettronici e liste di controllo
Setup checks, changeover records, cleaning logs, autonomous maintenance rounds and start-up approvals completed on screen, with every value validated against its limits as it is entered.
Digital 5S and Gemba audits
Audit templates completed on a tablet during the walk, with photo evidence attached, scores trended over time and findings converted straight into tracked improvement actions.
Deviations, actions and CAPA
Every deviation, idea and corrective action carries an owner, a due date and a verified outcome – the audit trail your improvement programme needs to prove that it works.
Real-time monitoring: see the loss while you can still fix it
Improvement that arrives with tomorrow’s report is history, not management. Accevo shows every line’s current state, rate and OEE as it happens – on the operator panel, on shop-floor screens and in the daily meeting – so a slowdown becomes a decision within minutes instead of a discussion next week.
Live dashboards on the floor
Large-screen visualisation of output against target, current status and OEE for every line and every shift.
Automatic alerts and Andon
Email, SMS and panel alerts triggered by machine signals the moment a line drops below its threshold.
Interactive daily meetings
Digital SQCDP and shift boards fed by live data, with improvement actions captured during the meeting.
Continuous improvement software for every role

Responsabile di produzione
See which line is behind target and why, on the shift that is running now. Automatic alerts when OEE drops below threshold mean you act during the run rather than at the post-mortem.

Responsabile del miglioramento continuo
Stop rebuilding the baseline before every event. Stops, defects and speed losses are already captured, categorised and ranked, so a Kaizen week starts with the top three losses instead of a week of data collection – and ends with a result you can defend.

Direttore di stabilimento / VP Operazioni
Comparable KPIs across lines, shifts and sites, with the improvement portfolio and its verified savings in a single view – the evidence base for your next capacity or automation decision.
Start with one line. Prove the gain. Then scale.
You do not need a plant-wide programme to begin. Connect one bottleneck line, run it for a fortnight and let the data show where the capacity is actually going. Most sites find enough hidden loss in those first two weeks to justify the next step – and because every module runs on the same platform, extending to more lines, more sites or full MES is configuration rather than a new project.

Contatto con il nostro esperto
Piotr Kańka, Esperto di software industriale
- Incontro online di 60 minutiti con uno specialista dedicato che presenta un sistema top di un settore simile
- Modellazione dal vivo del vostro processo produttivo
- Preventivo dopo l'incontro