

What is production execution?
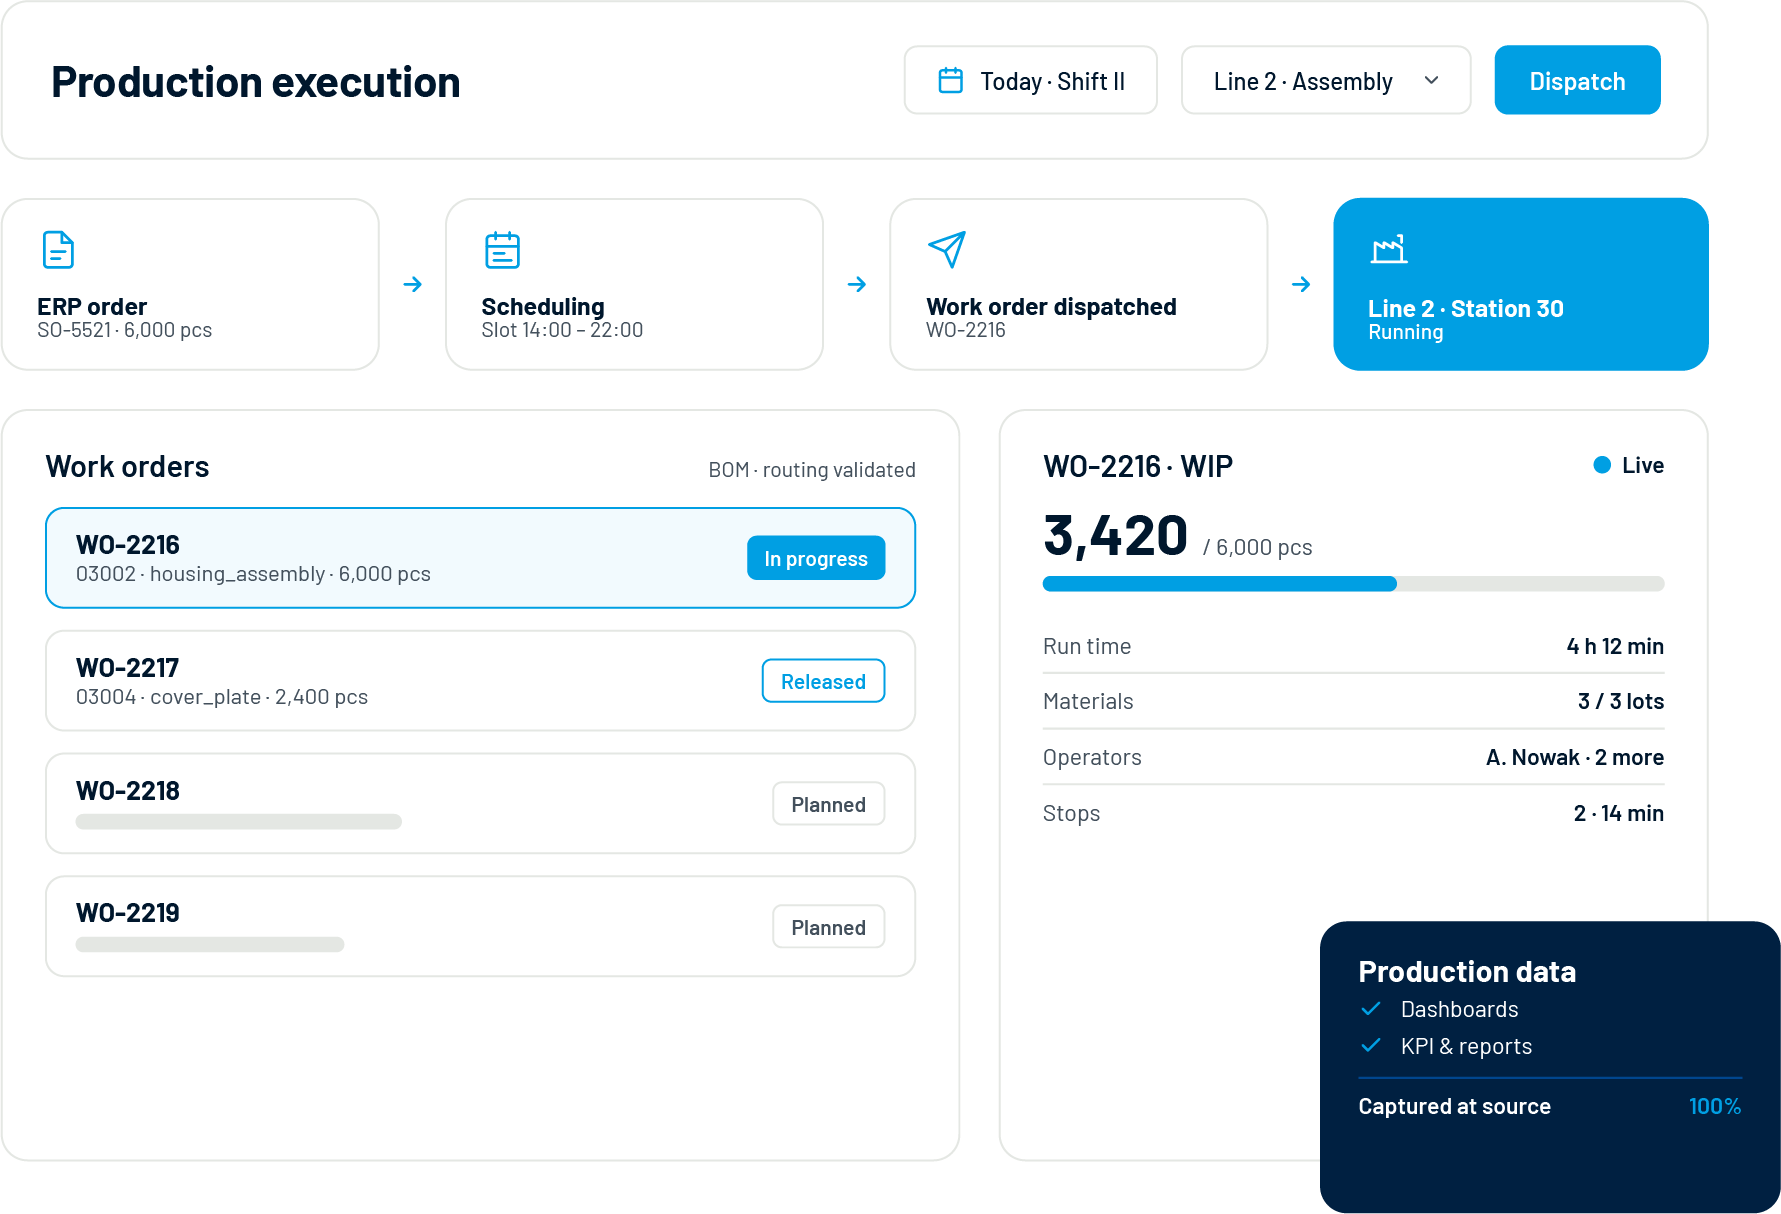
Realizacja produkcji is the layer between planning and machines: it takes production orders from ERP or scheduling, dispatches them as work orders to lines and workstations, and tracks what actually happens – quantities, times, materials, people, stops. In the ISA-95 model it is the heart of System MES: shop floor control that turns a plan into product, and raw events into structured production data.
Accevo’s production execution software manages the full work order lifecycle with BOM and routing validation, real-time WIP visibility and labor tracking. Because every event is captured at the source, the same module doubles as production management software for the analytics side: every dashboard, KPI and report reads from execution data that is already complete and already correct.
The work order lifecycle, end to end
Work order management software earns its keep by removing the gaps between planning, execution and reporting. In Accevo, one order flows through four stages without re-entry.
01
Create & import
Orders arrive from ERP or production scheduling software with BOMs, routings and due dates attached – or are created directly for unplanned work.
02
Dispatch & sequence
Orders are dispatched to lines and workstations in the planned sequence. Operators see their queue on the panel; supervisors see the whole floor.
03
Execute & track
Start, report, and complete operations with material consumption, labor tracking and quality checks captured in real time – shop floor tracking as a by-product of working.
04
Report & close
Good and bad quantities, scrap reasons, work logs and WIP status flow back to ERP automatically. The order closes with its full history attached.
BOM, routing and real-time shop floor tracking
Execution is only reliable when the system knows what should happen – and notices when it does not. Shop floor control software needs three things wired together:
BOM & routing management
Bill of materials and routings define the correct materials, operations and sequence for every product. BOM validation blocks wrong components before they reach the line, with alternative BOMs and routings supported.
Real-time WIP visibility
Work-in-progress is tracked by order, operation and workstation – so “where is order 4711?” is a glance at a screen, not a walk around the plant with a clipboard.
Labor & material reporting
Work logs record who worked on which machine and for how long; material consumption is reported per operation. Both feed costing, ERP backflushing and the performance analytics on this page.
5%
typical OEE improvement from removing stops and waste
15%
productivity gain after production digitalization at Alkaloid
100+
machines monitored in real time at a single site
0
spreadsheets between the shop floor and your reports
Manufacturing dashboards & KPI monitoring
The analytics half of the module: manufacturing dashboards that read directly from execution data. Real-time analytics for the control room, management reports for the morning meeting – one source, every audience.
Real-time production dashboard
Live OEE, availability, performance, quality and production progress for the whole factory or one line, machine, shift, order or product. Drill from the factory KPI to the workcenter behind it in two clicks.
Custom KPI configuration
There is no single way to measure every process. Define your own OEE calculation approach, custom production KPIs, TEEP and availability rules – so every team analyses performance on one consistent basis.
Shift & management reports
Automatic shift reports for handovers, daily and weekly management reports for reviews – production reports generated on schedule with OEE, losses, trends and comparisons, not assembled by hand on Monday morning.
Role-based views
Operators see their line, supervisors their area, plant management the site, group management every site. Same data model, each role sees what it decides on.
Mobile & remote access
Web-based data visualization on any device: check the real-time production dashboard from the office, home or another plant – and TV visualization for the shop floor itself.
Manufacturing BI & export
Export to CSV and Excel, schedule recurring reports, or connect Power BI and your business intelligence stack via API – production BI on live data instead of last week’s extract.
Find the loss behind the number
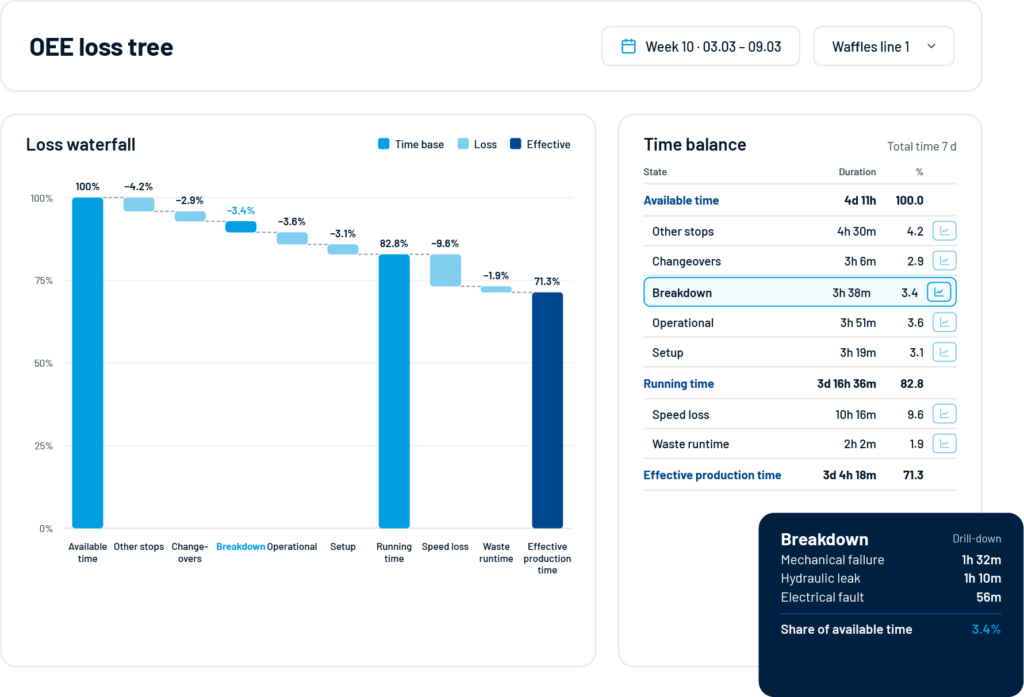
An OEE result tells you that performance changed. To improve it, you need to know why. Accevo breaks the result down through an Drzewo przyczyn spadku wskaźnika OEE – time, speed and quality losses – then lets you investigate the events behind each branch: unplanned stops by category, actual speed and cycle-time deviations by operation or equipment, rejects by product and component, and changeover durations compared across lines, products and orders. Because analytics and execution share one data model, every loss links back to the exact order, shift and machine where it happened – production reporting software that ends arguments instead of starting them.
Cloud vs on-premise MES: an honest comparison
Standard definitions
work for standard processes. OEE according to the textbook – availability x performance x quality – plus TEEP for capacity discussions, calculated identically across every line.
Out of the box:
- OEE, availability, performance and quality by line, machine, shift, order and product
- TEEP and utilisation for capacity and investment discussions
- Standard loss categories for stops, speed and quality
- Comparable results across every plant in the group
Your methodology
matters when product type, production flow, planning rules, quality checks or internal reporting standards do not fit the textbook. Accevo adapts KPI calculation to the way your factory manages performance.
Configured for you:
- Your own OEE calculation approach and custom production KPIs
- Loss and stop categories matching how your teams actually describe problems
- KPI scopes per audience - one order, one line, one workcenter or the whole site
- One consistent calculation basis, so meetings discuss actions instead of definitions
Zapytaj AI o przyczynę tego wyniku
When production performance changes, teams need answers, not only charts. With AI-supported analysis, users ask questions about production results directly: “Why did OEE drop on this line?” starts from the result and asks what changed. “What caused the biggest loss?” investigates stop reasons, speed loss, reject categories and orders. “What should we check first?” guides the next question using available production data and KPI definitions. The quality of the answer depends on the execution data in the system – which is exactly why analytics belongs on the same platform that runs the work orders.
Integration with ERP, planning and MES data
Execution and analytics sit between your business systems and your machines. Data flows both ways, in real time, aligned with the ISA-95 model.

ERP
Production orders, BOMs, routings and personnel come in from SAP, Microsoft, Oracle, Infor or Comarch. Progress, scrap, consumption and work logs flow back automatically for costing and stock.

Planning (APS)
Optimized sequences arrive from production scheduling software; real execution feedback returns, so the next plan starts from what actually happened on the floor.

Machines & MES data
Counters, states and process values stream in through IIoT machine connectivity, joining operator reporting in one MES data model that both execution and analytics read from.
Zapisz się do naszego newslettera
Sprawdzone w każdej branży produkcyjnej
FMCG
Usuwanie odpadów, redukcja przestojów i poprawa wskaźnika OEE o 5%
Wyroby tytoniowe i nikotynowe
Pozbądź się mikroprzestojów i zbędnej pracy
Przemysł Life Science
Zweryfikowany system wspierający zgodność z przepisami
Produkcja dyskretna
Redukcja odpadów, błędów i usprawnienie operacji