

Digital andon boards that show production status at a glance
Accevo turns live production data into clear andon boards for TVs and shop-floor screens. Operators and managers see current output, shift targets, OEE, machine states, downtime, defects and delays without opening an analytics tool.
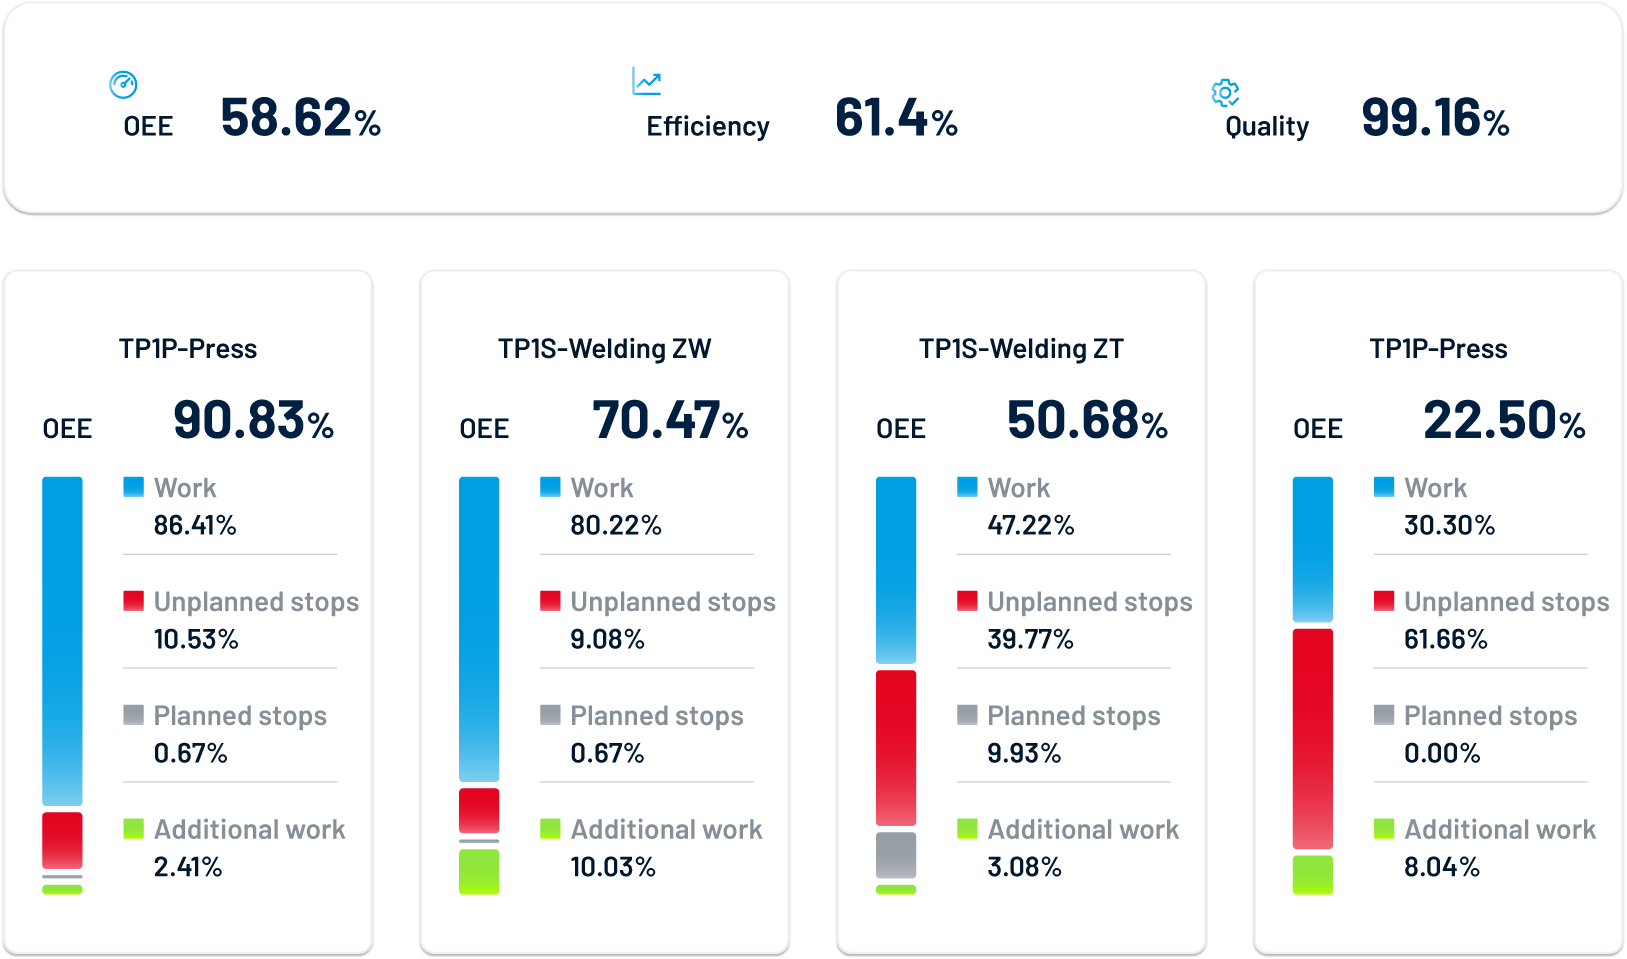
Make the production dashboard useful to the people on the floor
Each screen focuses on the decisions a team must make during the shift. Views can cover selected machines, lines, departments or the whole factory.
Show current status
Display machine states, line progress and active production orders using live shop-floor data.
Compare target and result
Place shift targets, hourly output and delays next to the current result.
Direct attention
Make downtime, defects and missed targets visible so teams know where to respond.
Key benefits of a digital andon system
Shared shop-floor view
Give operators, team leaders and managers the same current production picture.
Faster reaction
Expose stopped machines, delays and quality issues without waiting for a meeting or report.
Clear shift priorities
Keep targets, progress and problems visible throughout the production shift.
From live event to visible shop-floor action
Collect production events, apply display rules and update every screen automatically.
01
Collect the data
Read machine cycles and states or use validated operator and production reports.
02
Calculate the status
Combine current output with orders, targets, downtime, OEE and quality information.
03
Display the view
Publish the right production board to each TV, monitor or shop-floor screen.
04
Escalate exceptions
Use colours, alerts and priorities to draw attention to stopped or delayed production.
Build hour-by-hour boards around shift targets
An hour-by-hour board helps teams compare planned and actual output while there is still time to respond. Accevo can show the current shift, target completion and the production loss behind a delay.
Hourly output
Compare planned and completed quantities by hour, line, machine or production area.
Shift performance
Show OEE, production progress, downtime and remaining target for the active shift.
Quality and delay signals
Include defects, rejected quantity and overdue work in the same visual context.

Connect visual management with real-time production data
Digital visual management works when the displayed status is current, understandable and tied to action. Accevo uses the same production data layer as MES and OEE, avoiding separate manual board updates.
- Current order, product, quantity and production progress
- Machine and line state with active downtime
- OEE, shift target and hour-by-hour performance
- Outstanding defects, delays and other exceptions
- Views for operators, team leaders and plant management
A visual factory on any production screen
Configure focused views for the equipment and teams responsible for the next action.
Andon board
Production dashboard
Production board
KPI display boards
Manufacturing digital signage
Configurable scope
Choose the KPIs that belong on the wall
Keep each screen readable by showing only the measures that help the local team act.
- Fortschritt der Produktion: Display completed quantity, plan, remaining target and expected delay.
- Equipment state: Show running, microstop, stop and offline states with current duration.
- Quality and downtime: Present rejects, defects and the largest active production losses.

Design your digital andon board
Show us the screens, production areas and decisions your teams manage during a shift. Accevo will propose the board structure, data sources, refresh rules and exception views for your visual factory.
Digital andon system - FAQ
A digital andon board is a live shop-floor display that shows production status, targets and exceptions. It helps teams see where attention is needed without relying on paper boards or delayed reports.
Views can include the current order, output and target, production progress, OEE, machine states, downtime, defects and delays for selected machines, lines or areas.
Yes. Accevo views can be displayed on TVs, monitors and other screens connected to the factory network. The final setup depends on the available devices and IT policy.
The board updates from machine cycles, equipment states and production reports as new data reaches Accevo. The practical refresh rate depends on the source and configured interface.
It compares planned and actual output for each production hour. Teams can see a growing delay early and react before the end of the shift.
No. An andon board prioritizes immediate shop-floor status and action. Analytics dashboards usually support deeper investigation over longer time periods. Accevo can provide both from the same data.
Related insights on online visualization

Digitale Dokumentation und Arbeitsablaufanweisungen
Digital work instructions software that puts the current version of every procedure on the operator panel, right where the team works.

Wartungsaufrufe (ANDON)
Andon system software that alerts the right technician the moment a machine stops – and tracks reaction and repair time against your targets.
Produktionsausführung
Work order management software that guides operators through every order and gives supervisors real-time control of the shop floor.