

Ready-made production reports for every view of your plant
Das Modul Dashboards & Reports ist eine komplexe Analyseplattform mit gebrauchsfertigen Berichten. Mehr als ein Dutzend Berichte, um Produktion, Qualität, Trends und Ziele zu analysieren und verschiedene Einblicke in die Produktion zu erhalten. Die Berichte können aus der Perspektive der Anlage, der Maschine und in verschiedenen Zeitbereichen betrachtet werden.
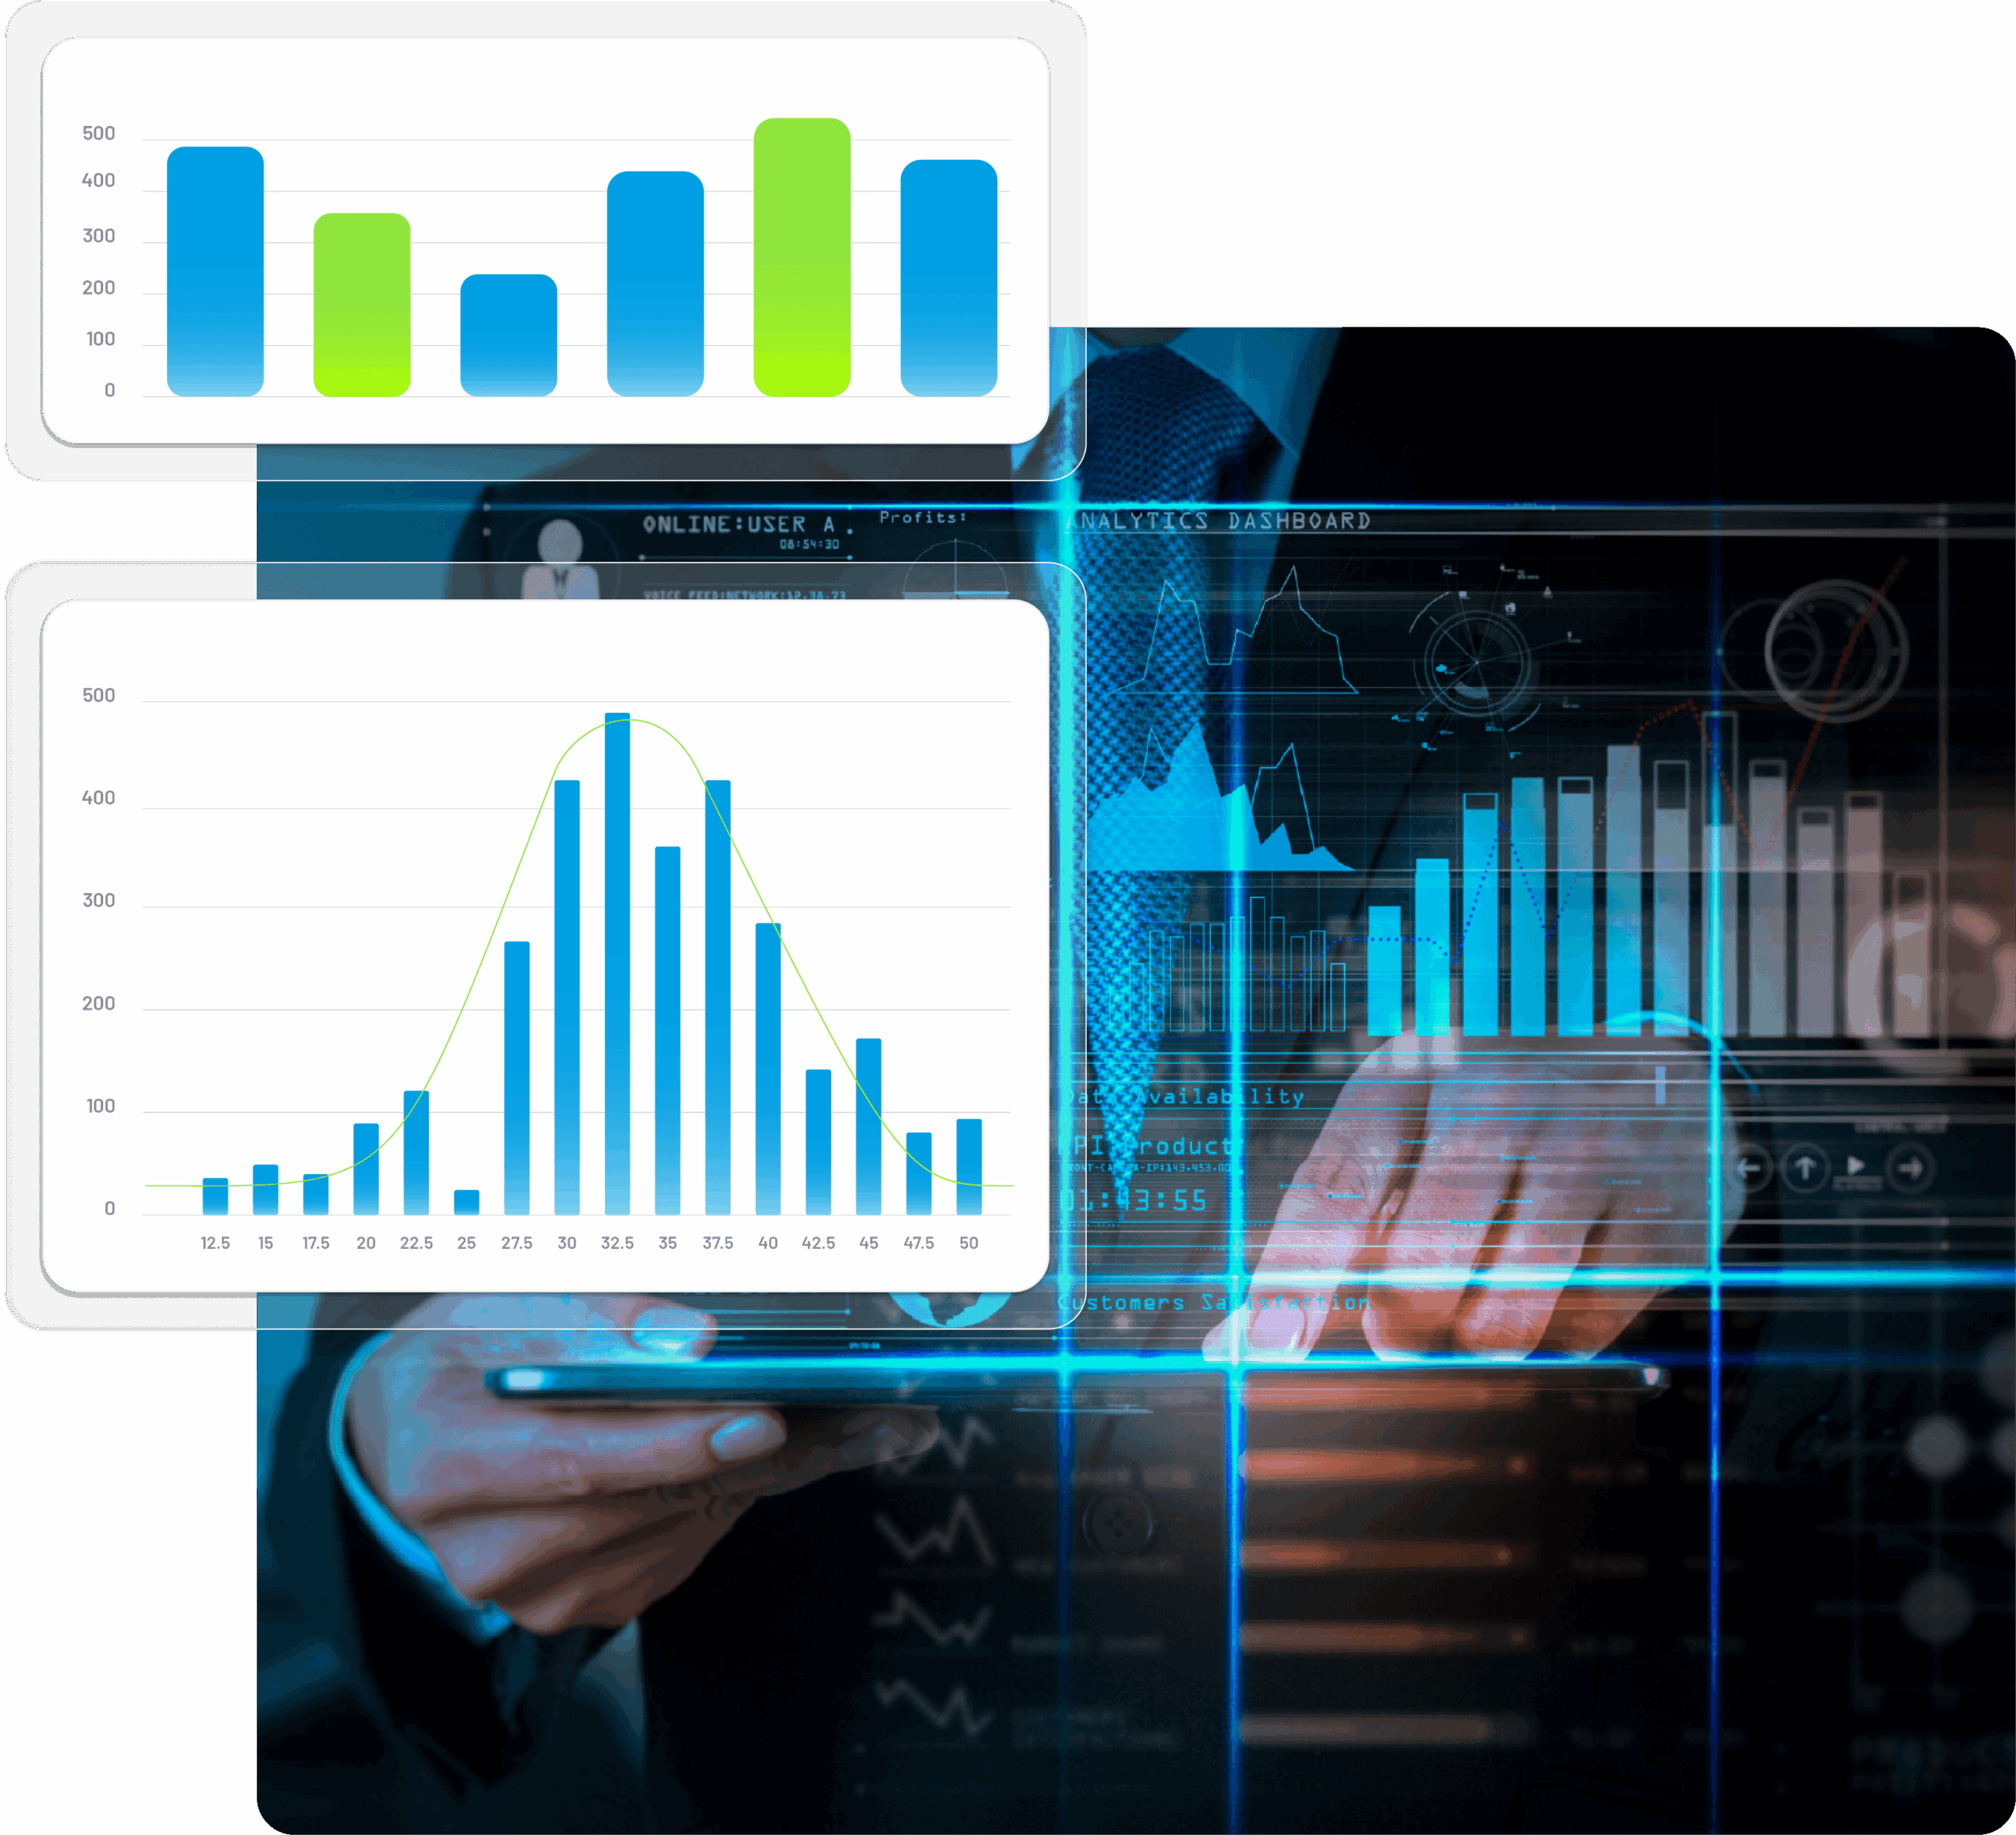
Analyse your production process in seconds
The daily rush makes it difficult for us to stop, create reports and production comparisons. Accevo dashboards and reports allow you to easily see your factory from different perspectives and quickly understand trends and issues.
Check performance, availability and quality against specific production orders, plants divisions or machines.

See why you missed the production deadline
Der OEE-Wasserfall ist ein leistungsfähiges Instrument, das Ihnen schnell eine Antwort auf die Hauptgründe gibt, warum Ihr Produktionsplan nicht eingehalten wird. Überprüfen Sie die OEE-Tropfen, die in Ihrem Glossar definiert sind, und führen Sie eine detaillierte Analyse durch, um die Ursachen zu finden.
Key benefits of Accevo Manufacturing Analytics Software
Reports for every area
Analyse production, machines and quality in one place.
Live production dashboard
Follow ongoing production in real time, as it happens.
Analytics from any angle
View your data by plant, machine or time range.
Automatic report generation
Generate production reports automatically and fast.
Aggregated and detailed data
Access both aggregated and detailed data in seconds.
Export to Excel
Export data to Excel and build your own custom reports.
What can you track with a manufacturing KPI dashboard?
Das System präsentiert Produktionsberichte:
- Shift, day, week, month summary: good and defected production, OEE
- Machine’s performance: good and defected production
- Realization of production target
- Number and duration of failures, breakdowns, microstops
- Calculated item’s real cycle time for operations
- Graphical presentation of realized production orders on machines
- Comparison machines for work time, stop time, OEE
- Production orders and operations report: statuses (planned orders, started orders, finished orders, delayed orders) and progress
Das System erstellt Berichte über Maschinendaten:
- Machines states time: work, microstops, failures, breakdowns
- % share of machine states
- % share of machine stop reason
Das System präsentiert Qualitätsberichte:
- Defects Pareto for items and defect types
- Quantity of defects, scrap, and reworks for a selected time range
- Most defective machines and items
Außerdem zeigt das System Trenddiagramme mit OEE, Verfügbarkeit, Leistung, Qualität, Produktionsmenge, Maschinenhauptzustand, Anzahl und Zeit für Umrüstungen und Ausfälle, MTBF/MTTF/MTTR
Plan your Digital Work Instructions Demo
Stop rebuilding reports in Excel and read your plant in real time.
Book a 30-minute demo with an Accevo analytics expert. We will connect it to your production questions – OEE losses, machine comparisons, order progress and the reports your team actually needs.
Manufacturing Analytics Software - FAQ
Manufacturing analytics software turns machine and production data into ready-to-use reports on OEE, losses, quality and output. Accevo collects the data in real time and shows it by plant, machine and time range, so teams stop building reports in Excel and start acting on them.
Yes. The live production dashboard shows production as it happens - machine states, order progress, good and defective quantities. You can watch the current shift or open any past range without exporting anything.
Yes. The module ships with more than a dozen ready-made production reports: shift, day, week and month summaries, machine performance, failures, microstops and order status. Reports generate automatically, so no one rebuilds them by hand.
Yes. Beyond fixed reports you get aggregated and detailed data, trend charts and drill-down - for example the OEE waterfall down to root cause. If you prefer your own tool, export the data to Excel and build custom reports there.
From the machines and production orders on your floor. Accevo reads machine signals and production status directly, so reports reflect actual production, not numbers typed in after the shift.
Yes. Every report opens by plant, machine or time range. You can compare machines by work time, stop time and OEE, or compare shifts and lines using the same definitions.
Aktuelle Artikel

Wie können Sie Ihre Besprechungen in der Werkstatt effizienter gestalten?
Besprechungen in den Betrieben gehören zum Alltag und sind für einen effizienten und effektiven Arbeitsablauf unerlässlich. Die Art und Anzahl der

Wie überwacht und steuert man eine automatisierte Fertigungsstraße?
Mit dem Aufkommen von Industrie 4.0 ist eine breit angelegte Automatisierung von Produktionslinien zu einem Standard geworden, ohne die sich ein modernes Unternehmen nur schwer vorstellen lässt. Um das Potenzial

Wie kann man den Produktionsfortschritt effektiv in Echtzeit überwachen?
Die Verfolgung von Veränderungen in der Produktion - Fortschritte, Durchlaufzeiten, mögliche Ursachen für Verzögerungen - spielt in der Industrie eine besonders wichtige Rolle. Produkte ausliefern