

Ready-made production reports for every view of your plant
仪表盘和报告模块是一个复杂的分析平台,具有随时可用的报告。十几份报告可以分析生产、质量、趋势和目标,并获得各种生产洞察力。报告可以从工厂、机器和不同时间范围的角度查看。
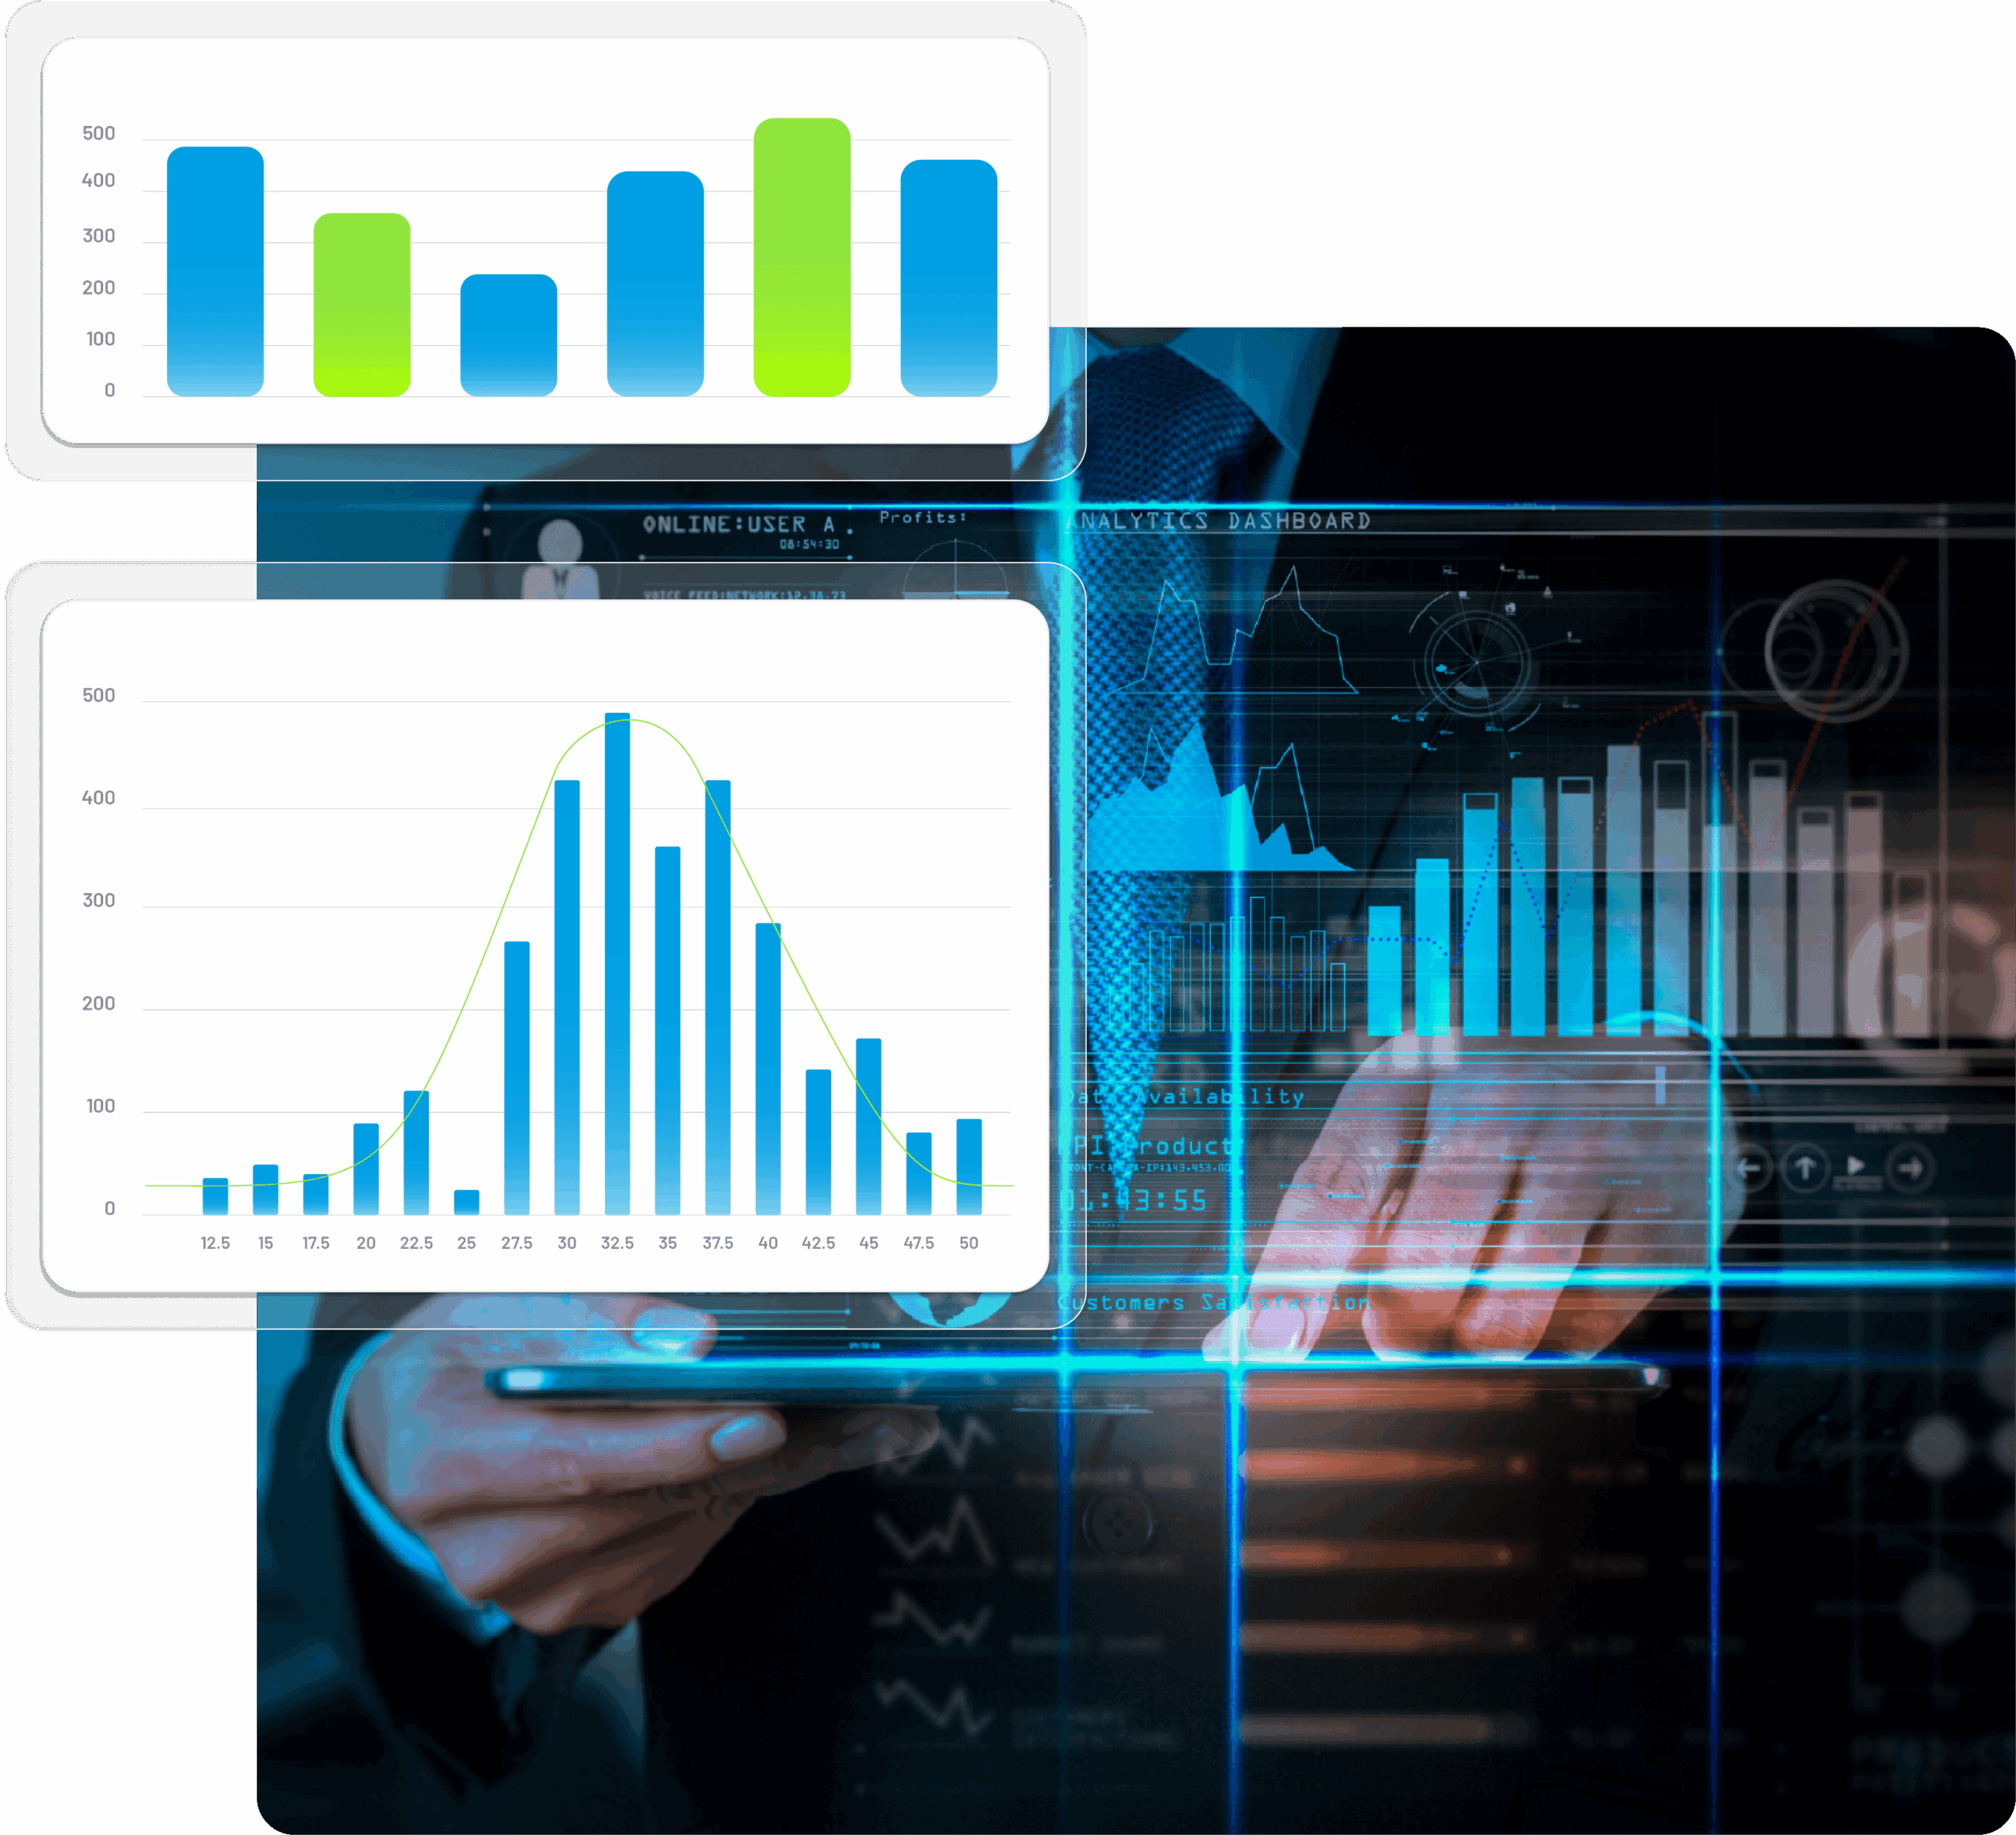
Analyse your production process in seconds
The daily rush makes it difficult for us to stop, create reports and production comparisons. Accevo dashboards and reports allow you to easily see your factory from different perspectives and quickly understand trends and issues.
Check performance, availability and quality against specific production orders, plants divisions or machines.

See why you missed the production deadline
OEE瀑布是一个强大的工具,它能迅速给你答案,让你知道为什么你的生产计划没有实现的主要原因。检查根据你的词汇表定义的OEE下降,并进行深入分析以找到根本原因。
Key benefits of Accevo Manufacturing Analytics Software
Reports for every area
Analyse production, machines and quality in one place.
Live production dashboard
Follow ongoing production in real time, as it happens.
Analytics from any angle
View your data by plant, machine or time range.
Automatic report generation
Generate production reports automatically and fast.
Aggregated and detailed data
Access both aggregated and detailed data in seconds.
Export to Excel
Export data to Excel and build your own custom reports.
What can you track with a manufacturing KPI dashboard?
该系统提出了生产报告:
- Shift, day, week, month summary: good and defected production, OEE
- Machine’s performance: good and defected production
- Realization of production target
- Number and duration of failures, breakdowns, microstops
- Calculated item’s real cycle time for operations
- Graphical presentation of realized production orders on machines
- Comparison machines for work time, stop time, OEE
- Production orders and operations report: statuses (planned orders, started orders, finished orders, delayed orders) and progress
系统呈现机器数据报告:
- Machines states time: work, microstops, failures, breakdowns
- % share of machine states
- % share of machine stop reason
该系统提出了质量报告:
- Defects Pareto for items and defect types
- Quantity of defects, scrap, and reworks for a selected time range
- Most defective machines and items
此外,系统还显示了OEE、可用性、性能、质量、生产量、机器主要状态、更换和故障的数量和时间、MTBF/MTT/MTTR等趋势图。
Plan your Digital Work Instructions Demo
Stop rebuilding reports in Excel and read your plant in real time.
Book a 30-minute demo with an Accevo analytics expert. We will connect it to your production questions – OEE losses, machine comparisons, order progress and the reports your team actually needs.
Manufacturing Analytics Software - FAQ
Manufacturing analytics software turns machine and production data into ready-to-use reports on OEE, losses, quality and output. Accevo collects the data in real time and shows it by plant, machine and time range, so teams stop building reports in Excel and start acting on them.
Yes. The live production dashboard shows production as it happens - machine states, order progress, good and defective quantities. You can watch the current shift or open any past range without exporting anything.
Yes. The module ships with more than a dozen ready-made production reports: shift, day, week and month summaries, machine performance, failures, microstops and order status. Reports generate automatically, so no one rebuilds them by hand.
Yes. Beyond fixed reports you get aggregated and detailed data, trend charts and drill-down - for example the OEE waterfall down to root cause. If you prefer your own tool, export the data to Excel and build custom reports there.
From the machines and production orders on your floor. Accevo reads machine signals and production status directly, so reports reflect actual production, not numbers typed in after the shift.
Yes. Every report opens by plant, machine or time range. You can compare machines by work time, stop time and OEE, or compare shifts and lines using the same definitions.


