

Microstops & Downtime Tracking Software
Stop the stops. Accevo detects every interruption a manual downtime log will never capture - including stoppages of a few seconds - attributes each one to a machine and a cause, and ranks them by the minutes they actually cost you.
Automatic machine downtime tracking for FMCG, pharma, tobacco and packaging lines. Read straight from the PLC, so the number nobody argues with arrives during the shift rather than after it.
What is downtime tracking - and why microstops break it
Downtime tracking software records when equipment stopped, for how long and why. Done manually, it captures the failures somebody had time to write down. Done automatically, it captures everything – and on a fast line, everything is a very different number.
A 微站 is a brief interruption, typically under five minutes and often only a few seconds: a jam, a misfeed, a momentary starve. Individually trivial, which is exactly why nobody logs them. Collectively they are frequently the largest single loss in the plant, and they are invisible in every report you currently have.
That is the gap this module closes. Not “better downtime reporting” – the same reporting, against a complete dataset for the first time.

A manual downtime log vs automatic downtime tracking
Ask a line manager why output missed target and you will get a considered, sincere answer assembled from memory several hours after the fact. The stops that were long enough to remember are in it. The two hundred that were not are the reason the number does not add up.
Once the line is connected, the reconciliation disappears. Every stop is timestamped from the controller, categorised, and totalled – so the morning meeting argues about the fix rather than about the data.
With a manual downtime log:
- Stops under five minutes almost never recorded - the largest loss stays invisible
- Causes assigned from memory hours later, if they are assigned at all
- Line running below rated speed with no explanation anyone can evidence
- Blocking and starving attributed to whichever machine happened to halt
- Two departments arriving at the meeting with two different downtime figures
With automatic downtime tracking:
- Every stop captured from the PLC, down to a few seconds, with a timestamp
- Structured reason codes, so stops aggregate across shifts, lines and sites
- Speed loss separated from stoppage loss and from quality loss
- The constraining machine identified, not just the one that stopped
- One downtime number, computed the same way every day
50%
average stoppage reduction
Average reduction in stoppages achieved per client after microstop causes were made visible and ranked.
10%
average OEE growth
Based on real factory results across deployments, once the recovered minutes were converted into scheduled output.
11%
average MTBF growth
Mean time between failures improves as repeat microstop causes are eliminated rather than repeatedly cleared.
6 months
typical ROI
Typical payback window after implementation – most of it from losses that needed no capital investment to remove.
What the system actually does
Six capabilities, all of which exist to answer one question faster than a person can: which stop, on which machine, for what reason, costing how many minutes.
Automatic microstop detection
Interruptions detected from machine signals with no operator action, including stops far shorter than anyone would log by hand. Thresholds are defined per machine, because a five-second stop means something different on a filler than on a press.
Cause attribution and reason codes
Each stop assigned a structured reason – automatically where the signal identifies it, by the operator where it does not. Structured codes are what let stops aggregate into a pattern instead of a pile of comments.
Pareto and drill-down analysis
Dashboards that drill from plant to line to machine to cause, showing occurrence count, total duration and percentage impact on production – ranked so the biggest loss is unmissable.
Line-level blocking and starving
The line modelled as a chain, so a machine stopped because of its neighbour is not blamed for it. This is what stops the wrong fix being funded.
Thresholds and live alerts
Notifications when stop frequency on a machine crosses its threshold, so a developing problem is handled during the run rather than explained afterwards.
Reports and export
Ready-made stop, output and efficiency reports with aggregated and detailed views in seconds, exportable to Excel and feedable into your BI stack.

Machine Efficiency Loss Analysis, with focus on complexity impacts and machine reliability.
Reliable reporting, Insights into aggregated results, tactical use for shiftly/weekly prioritization per Loss Category. 100% flexibility in accounting for user’s KPI standards, good understanding of Lean Manufacturing KPIs.
Tonci M.
全球制造系统经理
BAT 克罗地亚

How the detection works
There is no clever inference involved, which is the point. The system reads what the machine already knows and applies rules you agreed in advance.
Signals straight from the controller
Machine states, cycle counts and speed read via direct PLC drivers – Siemens TCP, OPC DA and UA, Allen-Bradley, Mitsubishi, Modbus – or through I/O modules wired to existing signals where a legacy machine gives no access. See 机器连接.
Thresholds defined per machine
What counts as a microstop is set during the identification phase, machine by machine, against how that asset actually behaves – not by a global default that flags noise on half your fleet.
Correlation across shifts and products
Repeat stops grouped and correlated by product, format, material lot, crew and time of day, so the pattern behind them surfaces rather than the incidents alone.
Our approach: three phases
The same sequence on every deployment, because the analysis is only as good as the two phases before it – and skipping straight to dashboards is how monitoring projects produce data nobody trusts.
1. Identification
We analyse the current state of the factory, define what a microstop means for each machine, and set the stop-frequency thresholds with your team. Agreeing this before any data is collected is what makes the resulting numbers defensible.
2. Connectivity
Direct PLC connections over TCP, OPC DA and UA and Siemens protocols, with I/O modules for legacy equipment that exposes nothing. Our own automation engineers do the wiring and the validation.
3. Analysis
Drill-down dashboards showing causes, occurrence counts, total duration and production impact – turned into a ranked, costed improvement list rather than a wall of charts.
What you see on the dashboard
Four views that between them cover almost every downtime question anyone in the plant asks.
Live line status
Current state of every machine, output against target, and the stop happening right now – on the operator panel and on shop-floor screens.
Ranked loss list
Causes ordered by total minutes lost over the period you choose, with occurrence count and average duration alongside.
Stop timeline
Every stop on a time axis per machine and shift, which is how a repeating pattern becomes obvious in seconds rather than in a spreadsheet.
Comparison views
The same product on two lines, or the same line on two shifts – the gap between your best crew and your average one is usually the cheapest capacity you own.
How fast does it pay back?
Faster than most capital projects, because the first wave of gains needs no capital at all – it comes from stops that were always there and were simply never counted.
Weeks one and two: the reveal
The first fortnight almost always uncovers hours of weekly capacity lost to interruptions nobody knew about. Nothing has been fixed yet; the loss has simply become visible and costed.
Months one to three: the easy wins
The top of the Pareto is usually mechanical, procedural or material – adjustments, not investments. This is where the 50% stoppage reduction typically comes from.
Around six months: measured ROI
Typical payback window. Track it properly with 福利追踪器, which baselines before you start so the gain is verifiable rather than asserted.
Who uses microstop data
生产经理
See which machine is constraining the line right now and why, with alerts when stop frequency crosses threshold – so you intervene during the run instead of explaining afterwards.
持续改进领导
A ranked, costed loss list on demand, so a Kaizen week starts on the top three causes rather than on a fortnight of manual data collection. More in 持续改进.
Maintenance Manager
Repeat microstops are early warnings. Rising stop frequency on an asset is a reliability signal long before it becomes a breakdown – and it feeds straight into CMMS planning.
Microstop monitoring on real lines
Case Study
烟草
20% increase in overall equipment effectiveness
停车
Whitepaper
Identify how to detect downtimes
- 了解什么是微型停机以及如何防止微型停机
- Identify the best setup for your factoryFind out:
- 如何从机器上收集数据
- 您可以在您的生产线上进行哪些设置来识别微型止损点
- 如何在屏幕上识别停车站

常见问题解答
Microstops and downtime tracking, explained
Micro stops are brief production interruptions, typically lasting from a few seconds up to five minutes - jams, misfeeds, momentary starving. They are short enough that operators rarely log them, which is why they are missing from most downtime reports despite often being the largest cumulative loss on a line.
Because they are the losses your current reporting cannot see. A line that "just runs a bit slow" is usually accumulating hundreds of small stops per shift. They depress OEE, put delivery dates at risk, and because nobody records them, no improvement effort is ever aimed at them.
Downtime tracking software records equipment stoppages automatically - when, how long, which machine and why - by reading signals from the controller rather than relying on manual logs. That makes the dataset complete, and makes the resulting downtime figure something operations and finance can both accept.
Most systems record stops above a threshold that excludes microstops entirely, and attribute a stop to whichever machine halted rather than to the one that caused it. Accevo detects below that threshold and models the line as a chain, separating blocking and starving from genuine faults.
Usually not. Most machines with an existing PLC or SCADA are read directly over TCP, OPC DA or UA, Siemens, Allen-Bradley, Mitsubishi or Modbus. Where a machine exposes nothing useful our automation engineers add I/O modules, counters or sensors and wire them themselves.
Per machine, during the identification phase, with your team. A five-second stop means something quite different on a high-speed filler than on a press, so a single global threshold either floods you with noise or hides the loss.
Connectivity and live dashboards typically run within days on standard protocols. The first measurable improvements usually land within weeks, and typical ROI across deployments is around six months.
Any high-speed line where output depends on continuous running - 快消行业 and food, packaging, tobacco, and pharmaceutical packaging in particular.
近期文章
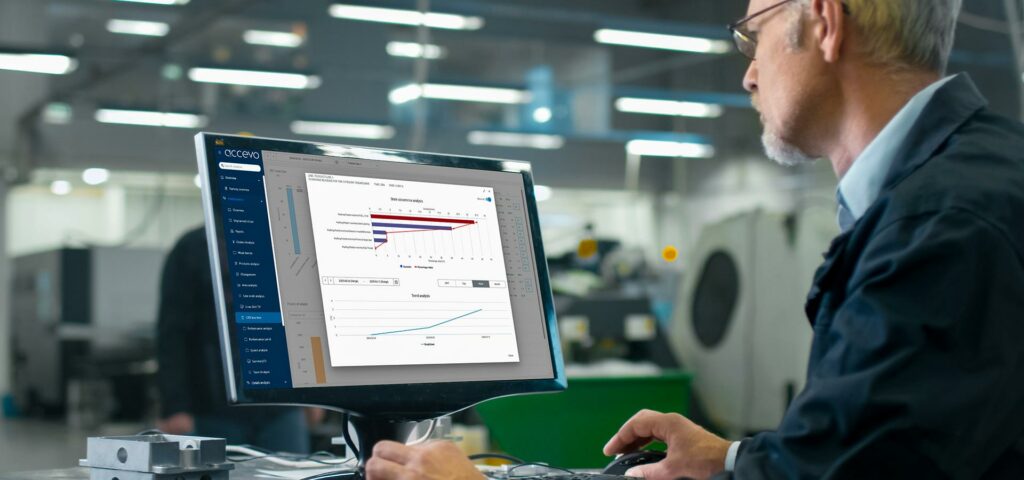
面向制造商的 OEE Micro Stops 智能软件
OEE 与微停机智能分析 Accevo OEE 微停机与智能分析系统可实时采集设备数据,自动检测微停机,并显示整条生产线中性能真正流失的具体位置。掌握每次停机情况,了解每处损失,通过更快速的决策提升 OEE。预约咨询 精准的 OEE 监控软件
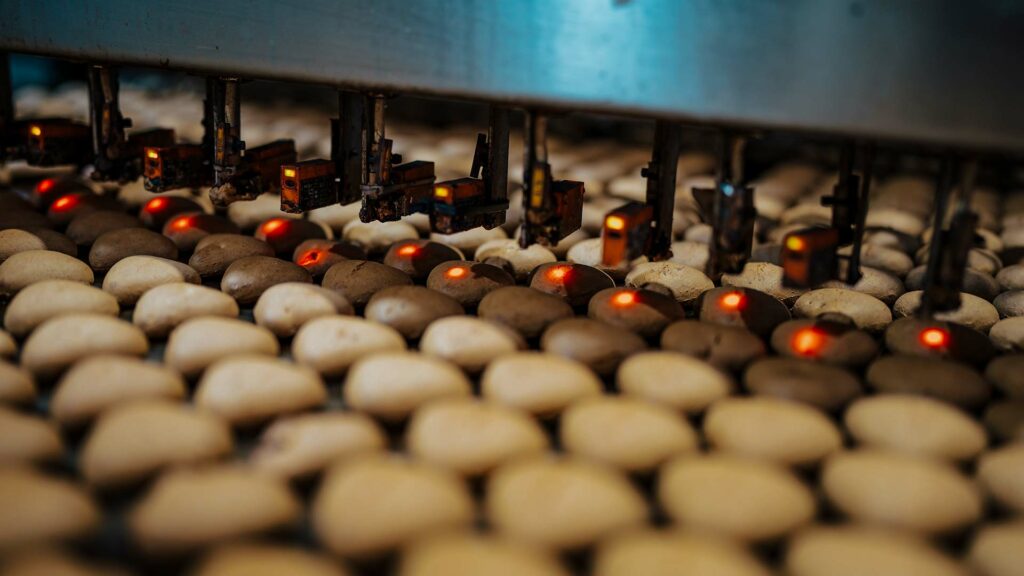

Accevo 微停机(生产监控、性能)系统在烟草厂的SMD(FMC)、FMD、THP和OTP上的应用
该工厂正处于数字化转型阶段,其中包括数字化、工作方法以及IWS就绪方法。烟草生产以高速大批量为特点,每分钟产量达1万件。所有微停机现象都十分明显,并对生产结果产生显著影响。机器的’