

Energy monitoring systems help manufacturers see when utilities are consumed and connect those readings to the production activity that explains them. A useful setup combines suitable meters, reliable timestamps, clear asset boundaries and output or operating context. Dashboards can reveal a change; people still need to check the cause and decide what to do.

What an energy monitoring system does in a factory
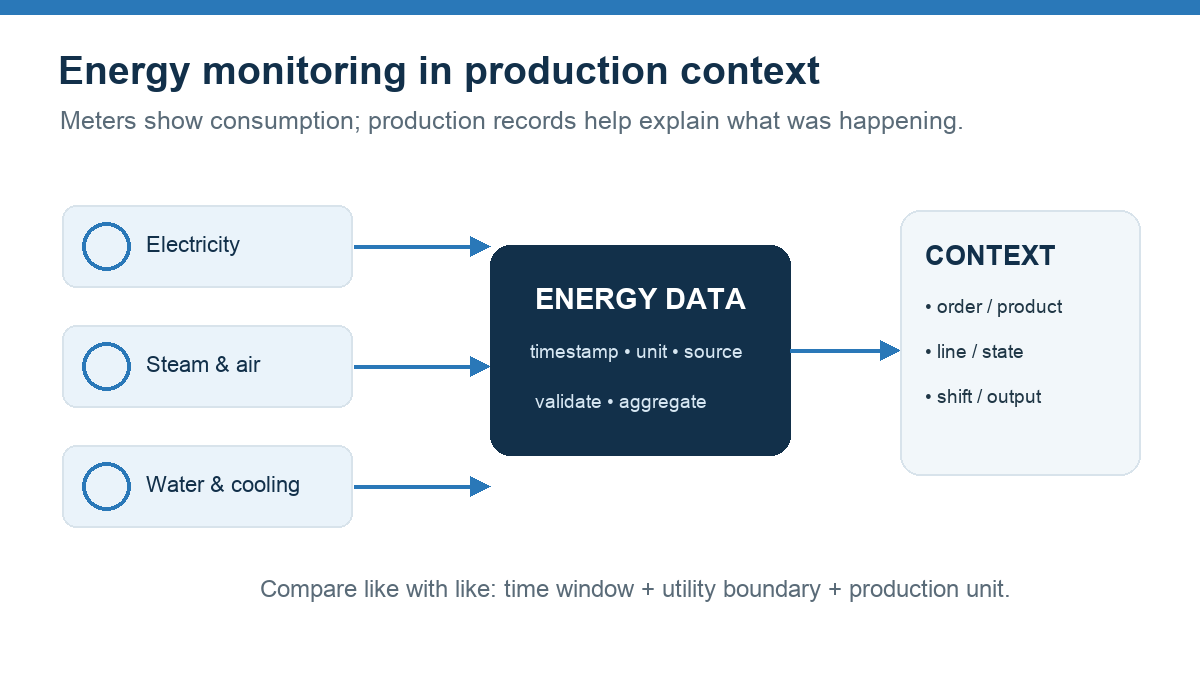
In manufacturing, energy monitoring can cover electricity and demand as well as utilities such as gas, steam, compressed air, chilled water or process water. Meter readings may be grouped by site, building, area, line, machine or utility system. The system can present trends, exceptions and comparisons for a defined time period.
A reading becomes more useful when it can be associated with the product, production order, machine state, shift or quantity produced at the same time. For example, a rise in electricity use may reflect longer operating hours, a product mix change, idle equipment or a real increase in energy per good unit. Consumption alone cannot distinguish those causes.
Terminology varies. Energy monitoring software can refer to metering and visualisation; an energy management system may also include organizational processes, review and improvement responsibilities. The U.S. Department of Energy’s guide to energy management information systems describes system capabilities and lifecycle considerations in a federal facilities context. Manufacturers should adapt those ideas to their own utility and production boundaries.
Start with the decision and the meter boundary
Before choosing a dashboard, state the decision the information should support. A utility team may need to find peak demand. Production may want energy per good unit by product or shift. Maintenance may need to find a persistent compressed-air baseload. Sustainability or finance teams may need documented energy totals under a defined boundary.
Then map the meters to the equipment and process boundary. Identify whether each device measures a site, distribution board, line, machine or utility branch. Record the unit, interval, meter owner, time zone, communication path and any known gaps. If multiple meters overlap or exclude a load, document that too; otherwise, users may sum the same consumption twice or mistake a partial view for a total.
Use the least intrusive data source that answers the question reliably. Existing utility meters, submeters, power analysers, control-system values or historian records may help, depending on their accuracy, coverage and sampling frequency. Confirm electrical and process-meter suitability with qualified personnel before installation or connection.
Connect energy readings to production context
Align the meter interval with the production data. A monthly bill cannot explain a short idle period, while high-frequency readings without order or state context can produce a noisy chart. Timestamps, units, daylight-saving changes, clock drift and missing values all affect comparisons.
For energy intensity, divide energy used by a matching measure of good output over the same boundary and time period. Keep the product and utility basis visible: kilowatt-hours per good case, cubic metres of gas per tonne, or another appropriate indicator. Avoid comparing different units or product mixes without a documented normalization method.
Manufacturing KPI frameworks also evolve. ISO 22400-2 Amendment 1 adds key performance indicators for energy management to the manufacturing operations management series. A published indicator still needs a local definition for its measurement boundary, source data and owner.
Choose the software by the work it needs to support
- Meter coverage: Can the system ingest the meters and utilities in scope, with the needed sampling interval and units?
- Production context: Can the readings be aligned with orders, output, shifts or equipment states from the systems you already use?
- Data quality: Can users spot missing, delayed, duplicated or implausible readings and trace them to a source?
- Analysis: Can the team compare a baseline with current consumption and investigate anomalies at the level the meters support?
- Workflow: Can an alert lead to an assigned investigation, recorded action and follow-up measurement?
- Governance: Are access, retention, units, calculation definitions and changes to the meter map managed clearly?
Do not assume that a platform called EMS automatically includes every meter connection or production integration. Check the actual interfaces, measurement scope, calculation method and operating responsibilities before procurement.
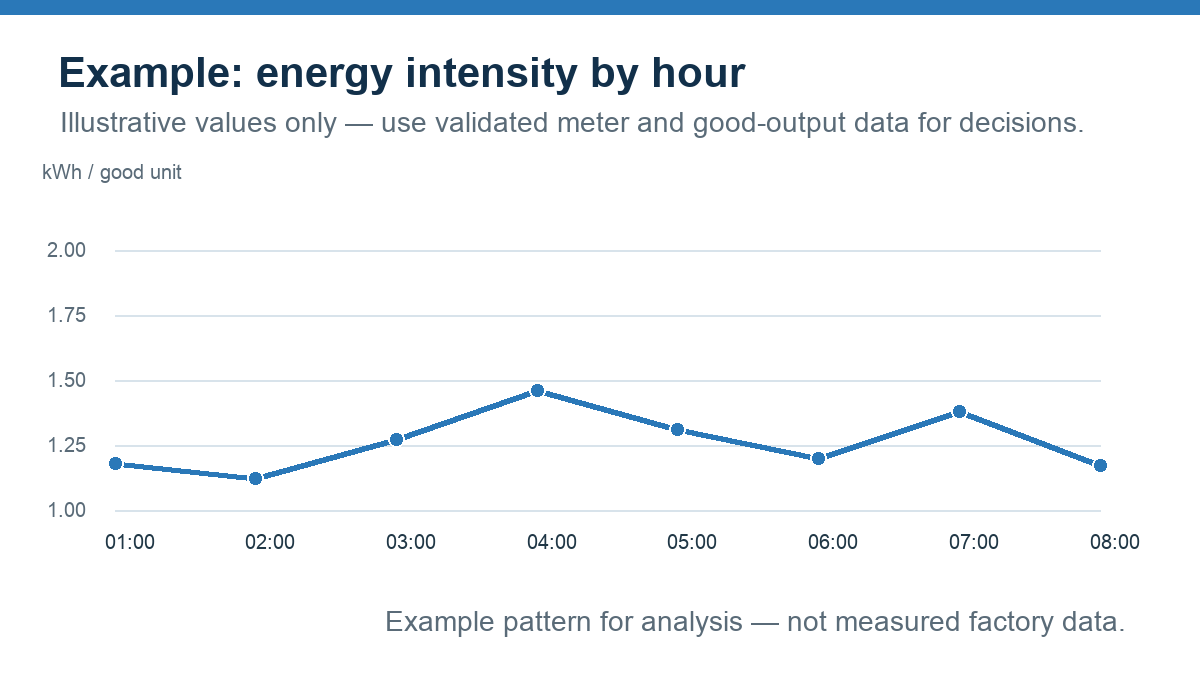
Illustrative energy-intensity chart
This chart uses invented example values to show why energy per good unit can be more informative than total consumption alone. It is not measured factory data. A real analysis needs validated meter readings, matched production counts and an agreed utility boundary.
Roll out in a small, measurable scope
- Choose one utility and one operational question with a named owner.
- Check the meter map, timestamps, units, intervals and missing-data behavior.
- Align energy and production records for the same time window and boundary.
- Review a baseline with operations, engineering and energy staff; explain anomalies before assigning causes.
- Record an improvement action and compare like-for-like periods afterwards.
An energy monitoring system provides visibility and analysis support; it does not make the energy-management decisions on its own. Explore the energy management system definition, Accevo’s Energy Management System software and the industrial data historian overview for related context. The next guide in this series will explain how to calculate energy per good unit.
Energy monitoring systems: common questions
What is the difference between energy monitoring and energy management?
Monitoring collects and presents energy information. Energy management can include goals, responsibilities, review and improvement actions alongside measurement and software. Organizations use these terms differently, so define scope when comparing systems.
Do manufacturers need a meter on every machine?
Not always. Start with the decision, the significant loads and the required level of attribution. A site or area meter may answer one question; machine-level allocation needs enough coverage and data quality to support it.
Can energy software calculate consumption per product?
It can calculate a production-normalized indicator when metered energy and product output share a reliable time period and boundary. Product-specific allocation may need additional submetering or a documented calculation method.
Will an EMS reduce energy consumption automatically?
Monitoring can make changes visible and help teams find investigation priorities. Savings depend on validated analysis, operational decisions and follow-up measurement; software alone does not prove an improvement.
