

Ready-made production reports for every view of your plant
Dashboards & Reports module is a complex analytic platform with ready-to-use reports. More than dozen reports to analyze production, quality, trends and targets and get various production insights. Reports can be viewed from the perspective of plant, machine and in different time ranges.
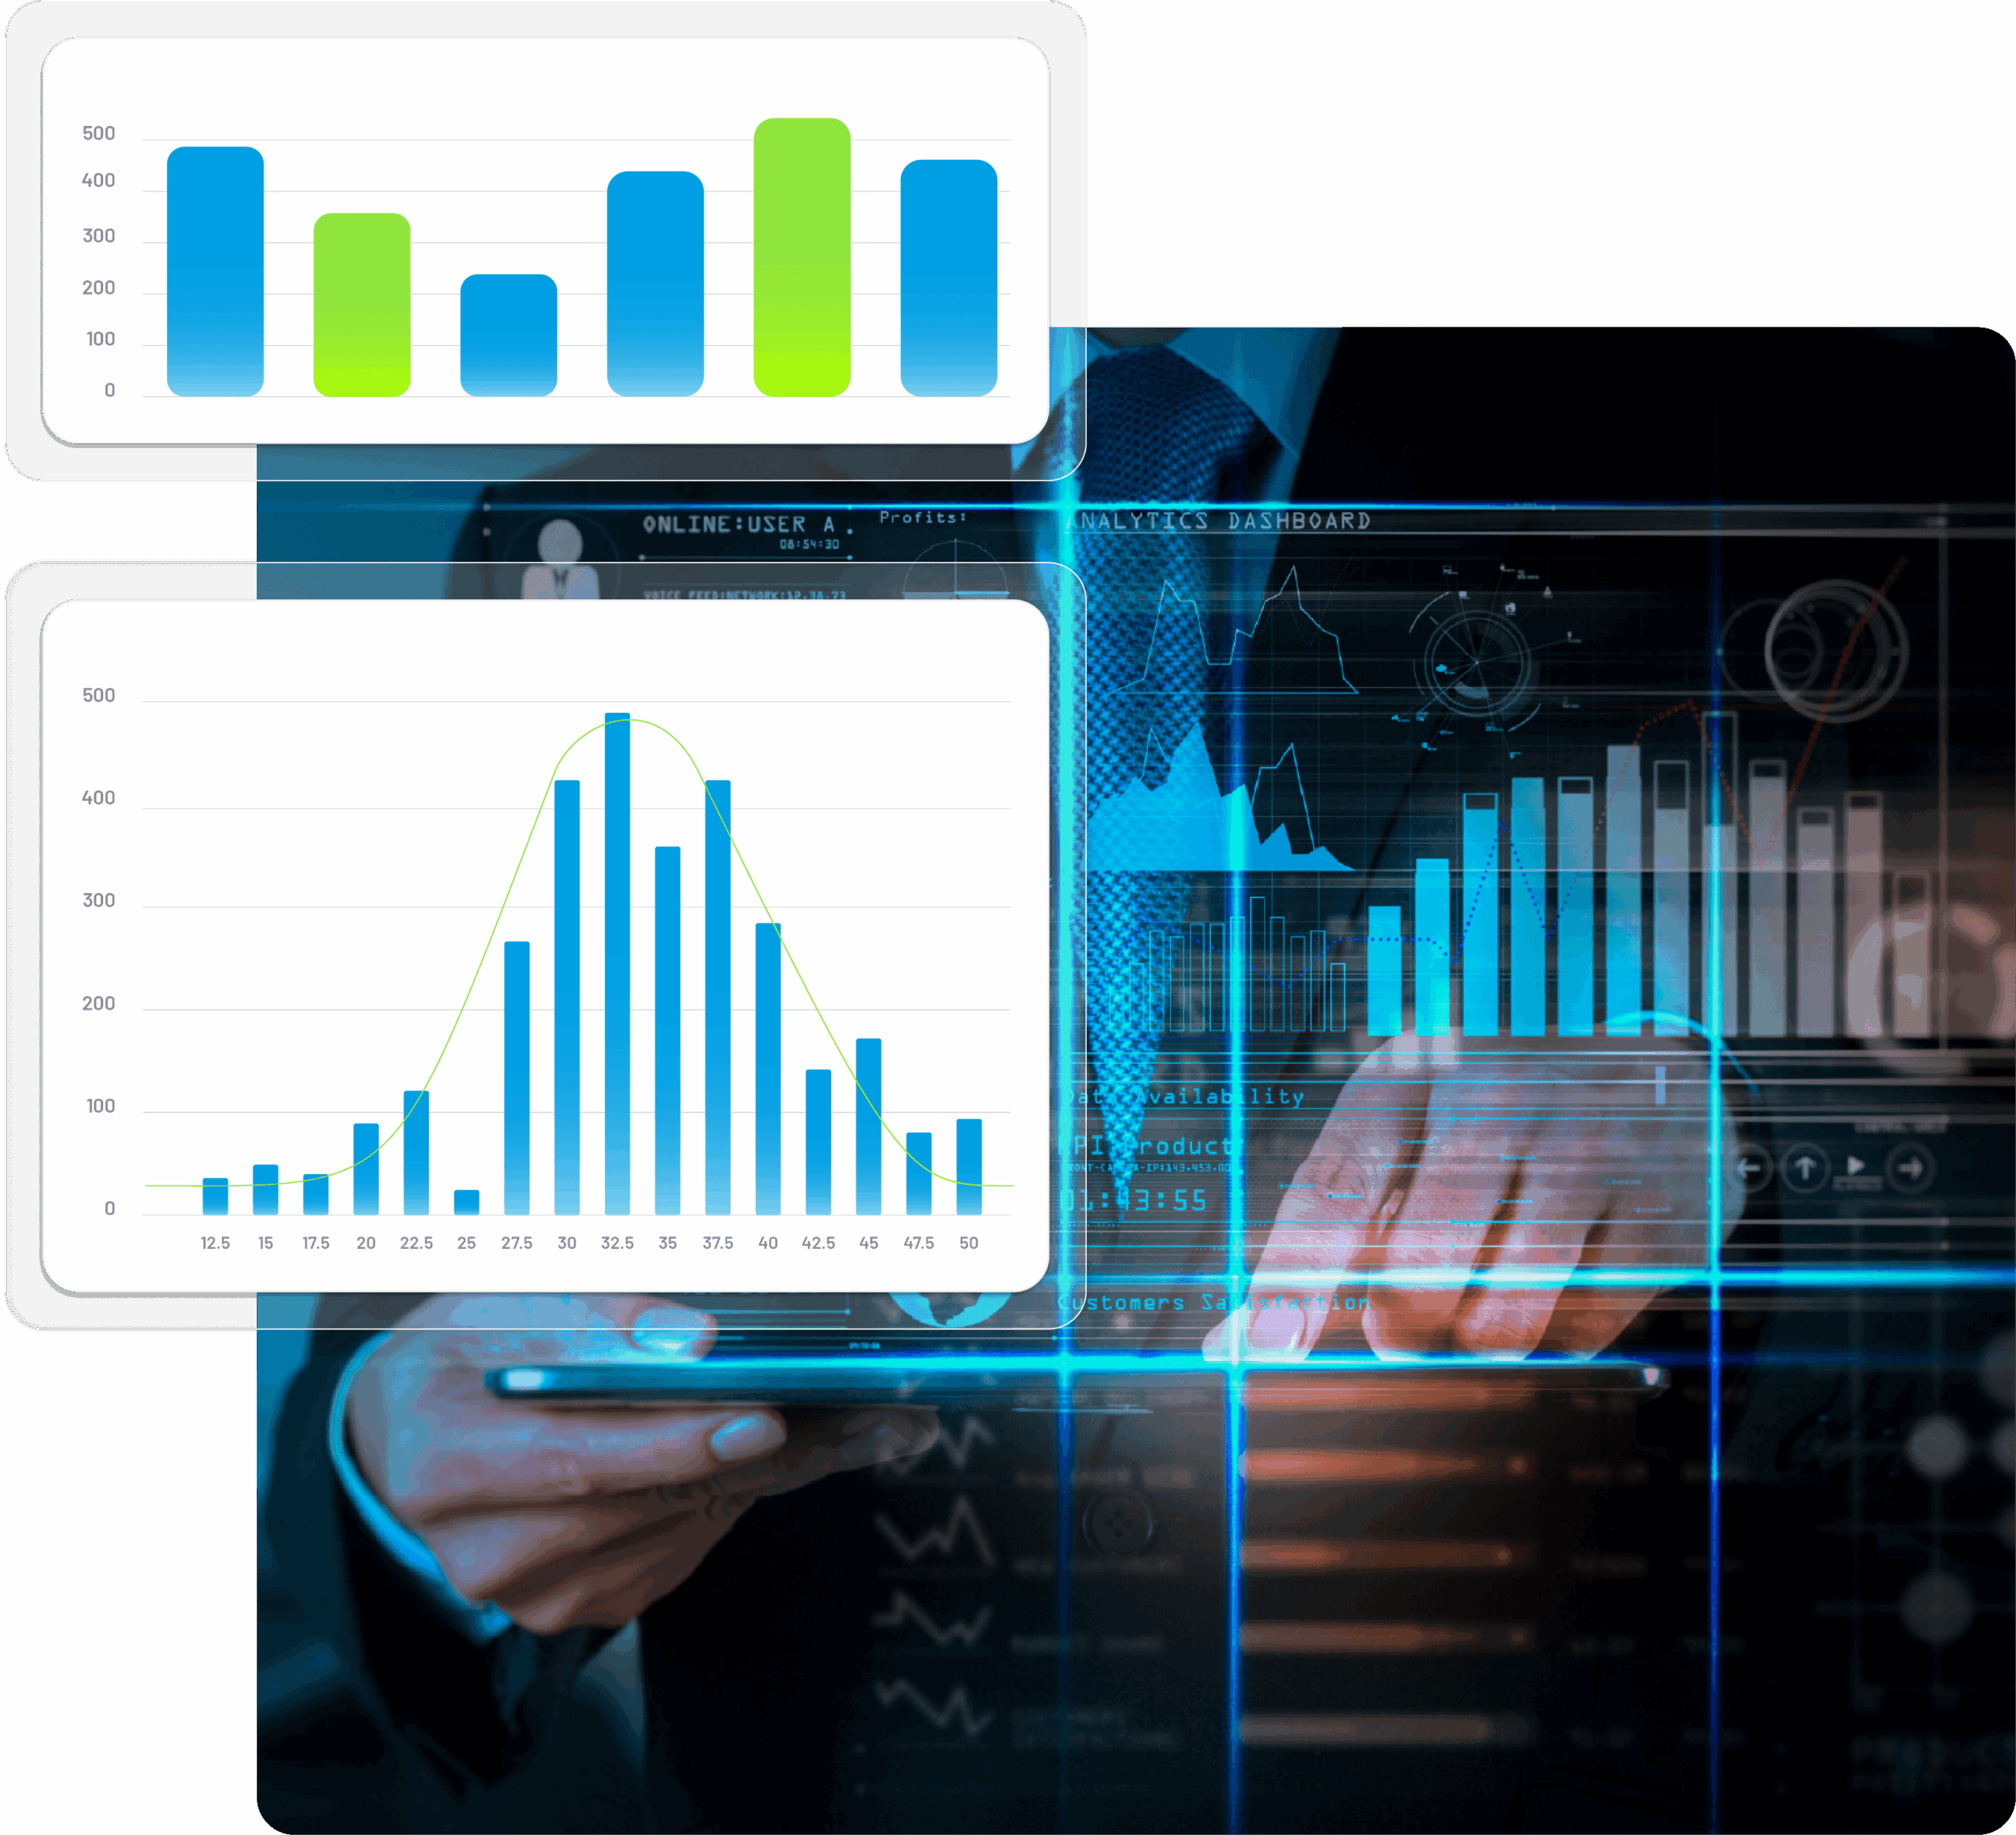
Analyse your production process in seconds
The daily rush makes it difficult for us to stop, create reports and production comparisons. Accevo dashboards and reports allow you to easily see your factory from different perspectives and quickly understand trends and issues.
Check performance, availability and quality against specific production orders, plants divisions or machines.

See why you missed the production deadline
The OEE waterfall is a powerful tool that will quickly give you the answer to the main reasons why your production plan is not being met. Check OEE drops defined according to your glossary and do a dig-down analysis to find root causes.
Key benefits of Accevo Manufacturing Analytics Software
Reports for every area
Analyse production, machines and quality in one place.
Live production dashboard
Follow ongoing production in real time, as it happens.
Analytics from any angle
View your data by plant, machine or time range.
Automatic report generation
Generate production reports automatically and fast.
Aggregated and detailed data
Access both aggregated and detailed data in seconds.
Export to Excel
Export data to Excel and build your own custom reports.
What can you track with a manufacturing KPI dashboard?
The system presents production reports:
- Shift, day, week, month summary: good and defected production, OEE
- Machine’s performance: good and defected production
- Realization of production target
- Number and duration of failures, breakdowns, microstops
- Calculated item’s real cycle time for operations
- Graphical presentation of realized production orders on machines
- Comparison machines for work time, stop time, OEE
- Production orders and operations report: statuses (planned orders, started orders, finished orders, delayed orders) and progress
The system presents machines data reports:
- Machines states time: work, microstops, failures, breakdowns
- % share of machine states
- % share of machine stop reason
The system presents quality reports:
- Defects Pareto for items and defect types
- Quantity of defects, scrap, and reworks for a selected time range
- Most defective machines and items
Also, the system presents trends charts with OEE, availability, performance, quality, production quantity, machine main state, number and time for changeovers and failures, MTBF/MTTF/MTTR
Plan your Digital Work Instructions Demo
Stop rebuilding reports in Excel and read your plant in real time.
Book a 30-minute demo with an Accevo analytics expert. We will connect it to your production questions – OEE losses, machine comparisons, order progress and the reports your team actually needs.
Manufacturing Analytics Software - FAQ
Manufacturing analytics software turns machine and production data into ready-to-use reports on OEE, losses, quality and output. Accevo collects the data in real time and shows it by plant, machine and time range, so teams stop building reports in Excel and start acting on them.
Yes. The live production dashboard shows production as it happens - machine states, order progress, good and defective quantities. You can watch the current shift or open any past range without exporting anything.
Yes. The module ships with more than a dozen ready-made production reports: shift, day, week and month summaries, machine performance, failures, microstops and order status. Reports generate automatically, so no one rebuilds them by hand.
Yes. Beyond fixed reports you get aggregated and detailed data, trend charts and drill-down - for example the OEE waterfall down to root cause. If you prefer your own tool, export the data to Excel and build custom reports there.
From the machines and production orders on your floor. Accevo reads machine signals and production status directly, so reports reflect actual production, not numbers typed in after the shift.
Yes. Every report opens by plant, machine or time range. You can compare machines by work time, stop time and OEE, or compare shifts and lines using the same definitions.
Artículos recientes

¿Cómo controlar eficazmente el progreso de la producción en tiempo real?
El seguimiento de los cambios en la producción -progresos, plazos de entrega, posibles fuentes de retrasos- desempeña un papel especialmente importante en la industria. Entrega de productos

¿Cómo supervisar y controlar una cadena de montaje automatizada?
Con la llegada de la Industria 4.0, la automatización ampliamente definida de las líneas de producción se ha convertido en un estándar, sin el cual es difícil imaginar una moderna

¿Cómo hacer más eficaces sus reuniones en el taller?
Las reuniones en el taller son prácticamente cotidianas y esenciales para que todo funcione con eficiencia y eficacia. El tipo y la cantidad de