

Data Historian for Manufacturing
Measurement Explorer (MEX) is the process data historian built into the Accevo platform. Define any signal from any source – PLC, SCADA, sensors, manual entry or ERP – set your measurement window, and MEX collects, timestamps and stores time-series data across your entire operation.
Your machines generate thousands of signals every minute. The question is whether you have the data when you need it, in the form that lets you decide. Every signal you do not collect today is a gap in next year’s analysis.


What is a data historian?
A data historian (also called a process historian, plant historian or SCADA historian) is a database system built to collect, timestamp and store high-frequency time-series data from industrial operations: temperatures, pressures, speeds, energy draw, counters and states from PLCs, SCADA systems and sensors. Where office databases store transactions, historian software stores what physically happened on your plant, second by second, for years.
That record is what makes serious analysis possible: comparing this week’s cycle times against last quarter’s, finding what changed before a breakdown, proving process conditions to an auditor. MEX is Accevo’s built-in manufacturing data historian – the OT data layer under every module of the platform, from OEE per EMS e CMMS.
Data historian vs time series database: what is the difference?
A generic time series database (or a SQL database bent into the role) stores timestamped values – and stops there. Everything that makes the data usable in a factory is your integration project: connecting PLCs, naming signals, attaching production context, building the viewer.
A manufacturing data historian is a time-series store plus the industrial layer around it. MEX runs on TimescaleDB underneath – proven time-series technology – and adds everything a plant needs on top, working out of the box.
A raw time series database gives you:
- Efficient storage and query of timestamped values - and nothing industrial
- Drivers and connectors for PLCs and SCADA left as your development project
- No notion of production orders, batches, shifts or machines in the data
- Visualisation, retention rules and access control bolted on separately
A data historian adds:
- Native industrial connectivity: OPC UA, OPC DA, Modbus TCP/RTU, MQTT, Siemens S7, Allen-Bradley
- Signal definitions with units, groups, recording strategy and retention policy per tag
- Automatic context enrichment: measurements linked to orders, batches and machines from MES
- Trend views, dashboards, exports, role-based access and audit trail included
<2s
trend render for queries spanning millions of points
1s
measurement resolution where the analysis needs it
1000s
of tags per deployment, with no hard upper limit
1 week
to first signals collected in most implementations
Key features of the MEX historian
Historian data collection is only half the job. MEX pairs the store with the tools that turn stored signals into answers – defined once, used everywhere on the platform.
Parameter & tag management
Every signal is a defined parameter: source channel, logical group, unit, recording strategy and retention policy. Multilingual names support international plants, and used parameters are deactivated rather than deleted, preserving history.
Views: drag-and-drop analysis
Build reusable views by dragging parameters onto customizable chart grids. Views are organised in folders, shared with view-only or edit rights, and applied to any time period – define the analysis once, reuse it every shift.
Charts built for process data
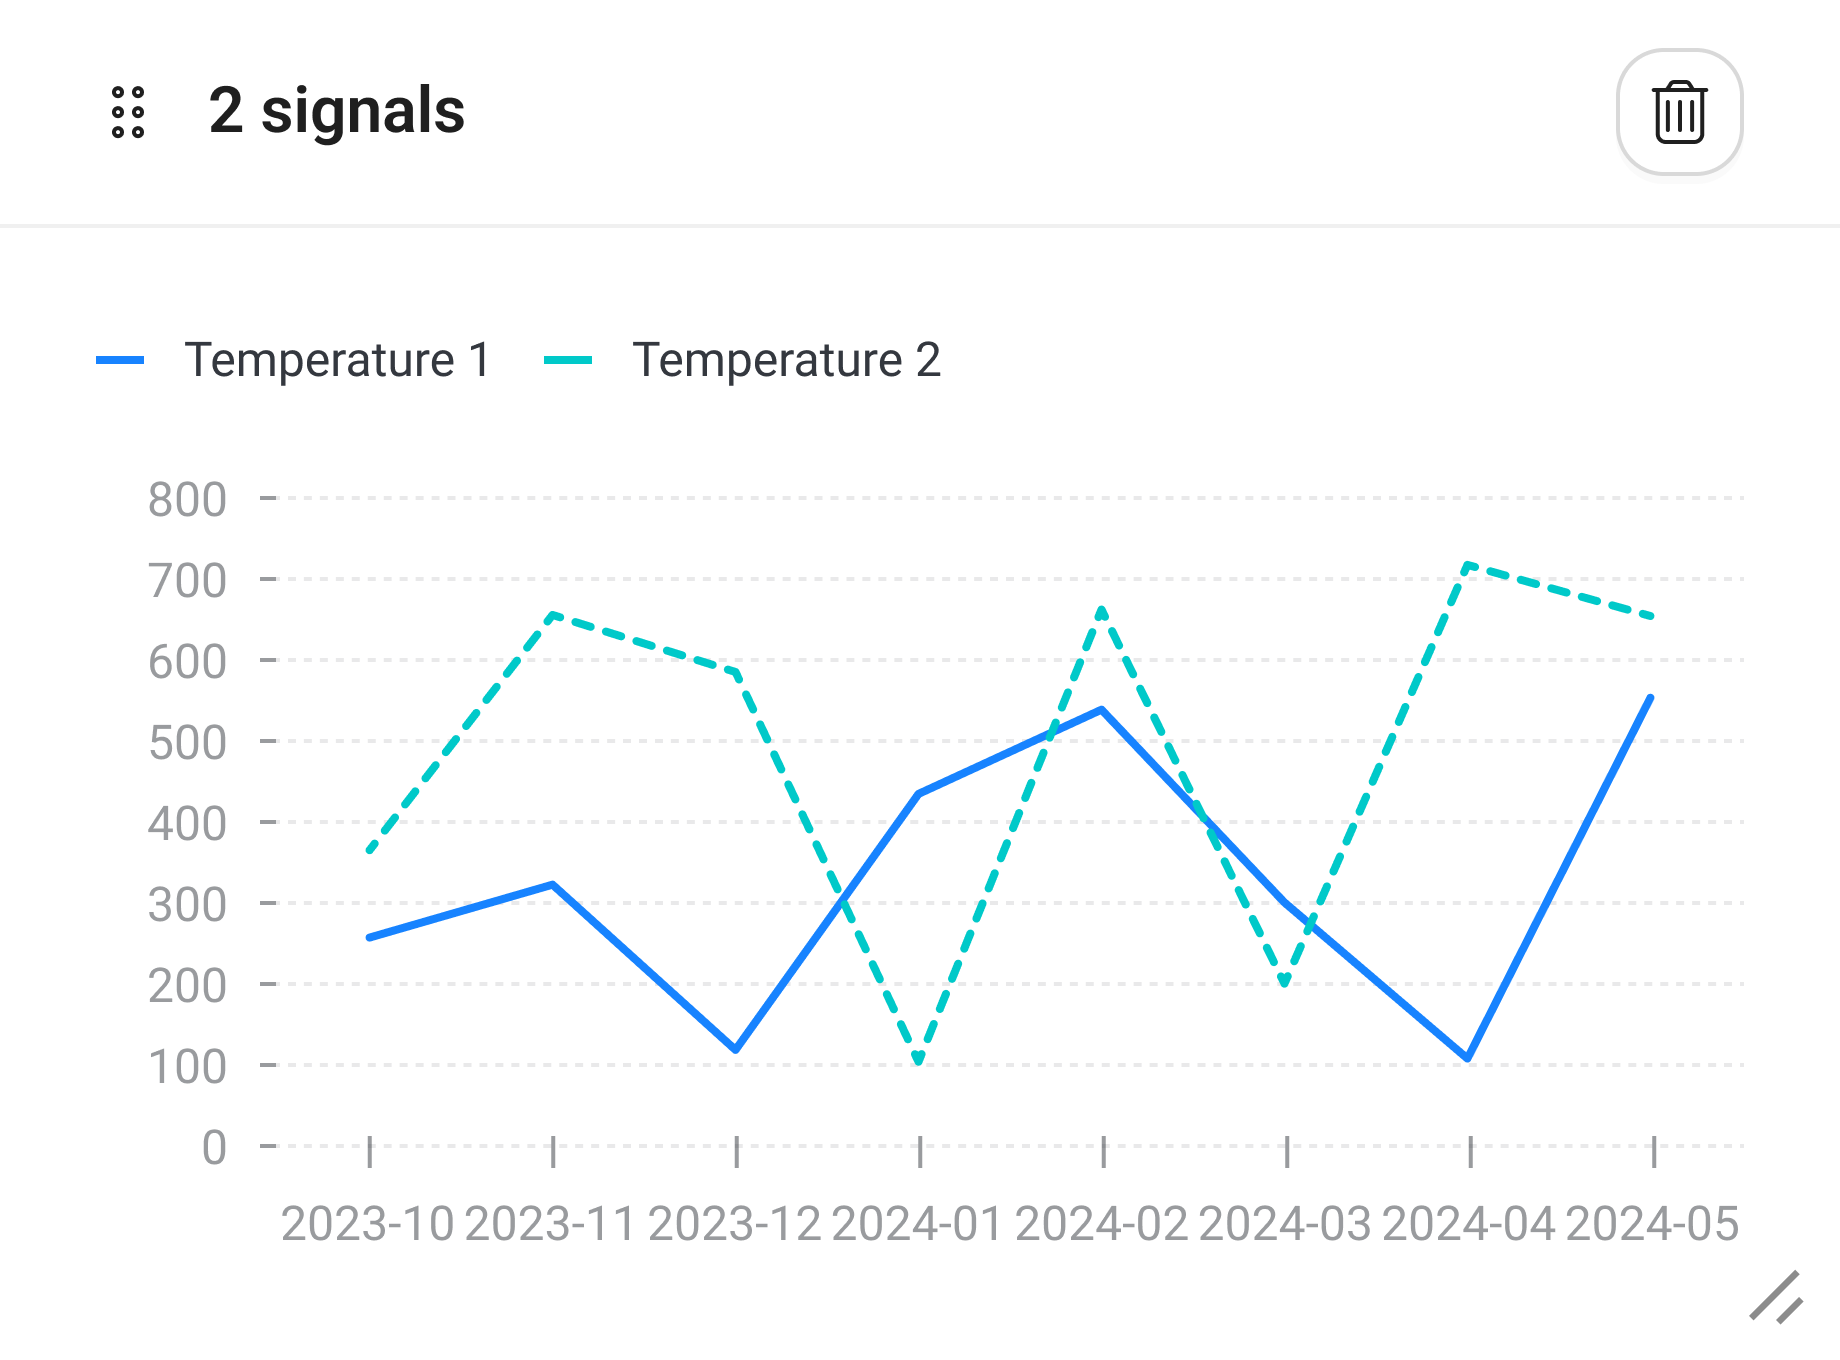
Line, column and multi-axis charts with per-parameter colours, dual Y-axes, X/Y offsets for correlation analysis, statistical trend lines over noisy sensor data, and detailed tooltips on every point.
Time navigation & playback
Previous/next stepping for sequential analysis, calendar pickers and preset ranges. Query the last 10 minutes, a full quarter, or the exact production order from six months ago – real-time and historical in the same view.
Retention policies per signal
High-frequency data is kept for the period your operation requires, signal by signal – 1-second vibration for 90 days, hourly energy totals for 10 years – so storage follows the value of the data.
Export & open access
Charts export to JPG/PNG, tables to CSV for Excel and statistics tools. The full store is accessible via API for Power BI, Grafana and any platform speaking REST or SQL – your data, never locked in.
Architecture: from PLC signal to answer
MEX is engineered as the signal infrastructure of the platform – a real time data historian designed for plant conditions, not a demo dataset.
Collect: native protocols & NATS
Machine data collection runs through Accevo’s protocol library – OPC UA, OPC DA, Modbus TCP/RTU, MQTT, Siemens S7, Allen-Bradley – with signals streaming over NATS messaging from distributed edge devices to the MEX Collector.
Store: TimescaleDB time-series engine
Measurements land in TimescaleDB, a PostgreSQL extension optimized for time-series workloads: efficient compression, long retention and fast aggregate queries over years of high-frequency data.
Enrich: production context attached
As measurements are stored, MEX links them with master data from MES – order, batch, machine, shift – so you can query by what was being produced, not just by timestamp.
Already running OSIsoft PI or another historian?
The signal layer every module reads from
MEX is not just a standalone product. It is the measurement infrastructure that makes the rest of the Accevo platform more powerful: one data source, same data model, zero integration overhead.
OEE & performance analytics
Connect production events to process signals – cycle time deviation, temperature excursions or pressure drops in the minutes before a stop – and explain OEE variation instead of just reporting it.
Energy monitoring (EMS)
Define electricity draw, gas flow and compressed air pressure once; EMS reads them as a time-series stream, down to the demand spikes created by machine starts.
Maintenance & condition (CMMS)
Vibration, temperature trends, runtime counters and condition indicators sit beside maintenance work orders. When a signal crosses a threshold, a trigger raises an alert and CMMS can create the work order before failure.
Quality & process control
Temperature, pressure and speed correlate with defect records to find the parameter range that predicts rejects – the raw material for SPC and predictive quality.

AI signal analysis: ask a question, get an answer
Ask the Accevo AI assistant in plain language. It queries the MEX signal store, correlates relevant measurements, and tells you what moved, when, and by how much. It does not replace the analysis – it removes the hour spent pulling signals manually before the analysis can start. Typical questions: “What does energy consumption look like on days when OEE drops below 70%?”, “What changed on Line 2 in the 30 minutes before the stop at 14:45 on Friday?”, “Show me the vibration trend for Compressor 4 over the last 90 days”, “Which signals correlate strongest with this month’s reject rate increase?”
How teams use Measurement Explorer
Different roles ask different questions. MEX gives each team a shared signal base for operational analysis – the same historian data, four different jobs done.
Maintenance engineer
You suspect a press is developing a problem. MEX shows vibration and temperature drifting upward over 90 days, so you schedule inspection before failure.
Energy engineer
MEX stores electricity draw at 1-second resolution beside production output, helping you identify the machine starts that create demand spikes.
CI manager
Cycle time data for every machine and shift shows which station explains OEE variation across similar products – measured, not argued.
Quality manager
Process temperature, pressure and speed are correlated with defect records to find the parameter range that predicts rejects.
Governance, security & multi-site
Historian data is operational evidence. MEX treats it that way, with the controls IT and quality expect from a system of record.
Role-based access
Administrator, Editor and Viewer roles govern who can define parameters, build views or only read them – scoped per organisation, so each site manages its own signals.
Complete audit trail
Parameter definitions, view configurations and access patterns are recorded for compliance and security review – who defined what, who changed it, who looked.
Multi-site by design
One MEX instance serves multiple plants or divisions, with data isolation between organisations and the option to benchmark across sites when you want to.

Contatto con il nostro esperto
Piotr Kańka, Esperto di software industriale
- Incontro online di 60 minutiti con uno specialista dedicato che presenta un sistema top di un settore simile
- Modellazione dal vivo del vostro processo produttivo
- Preventivo dopo l'incontro
Domande frequenti
Data historian software, explained
A data historian is a database system built to collect, timestamp and store high-frequency time-series data from industrial equipment - PLCs, SCADA and sensors - and keep it queryable for years. It is the system of record for what physically happened in production, used for trend analysis, troubleshooting, energy monitoring and compliance.
A time series database is the storage engine; a data historian is the industrial product around it. MEX uses TimescaleDB for storage and adds native PLC/SCADA connectivity, tag management with units and retention policies, production context from MES, trend visualisation, exports and access control - the parts that would otherwise be your integration project.
No. MEX is Accevo's built-in historian layer, handling signal collection, time-series storage and query access within the platform. If you run PI System or Wonderware Historian, MEX operates alongside them - or replaces the historian function for Accevo-managed signals.
MEX connects through Accevo's native protocol library: OPC UA, OPC DA, Modbus TCP/RTU, MQTT, Siemens S7, Allen-Bradley and others - plus manual entry and ERP data. Distributed edge devices stream signals over NATS messaging to the MEX Collector.
The signal count scales with your licensing tier. Most deployments start with a few hundred tags and expand as teams define new measurement needs. There is no hard upper limit on signal volume, and trend queries spanning millions of points render within about two seconds.
Yes. MEX data is accessible via API and connects to Power BI, Grafana or any BI platform supporting REST or SQL queries. You can also export selected time ranges to Excel or CSV, and charts to JPG or PNG.
As long as you decide - retention policies are set per parameter. Keep 1-second data for the analysis window that needs it and aggregated values for years, so storage cost follows the value of the data rather than a single global setting.
MEX can be activated as a standalone data historian or as part of a broader platform deployment. It integrates natively with OEE, EMS and CMMS, but does not require them to operate - and most teams have MEX collecting first signals within a week of implementation.