

Continuous Improvement & Lean Manufacturing Software
One platform for OEE improvement, microstop and downtime analysis, paperless documentation and real-time monitoring – running on production lines in FMCG, pharmaceuticals, tobacco and discrete manufacturing.


What is continuous improvement in manufacturing?
Continuous improvement is the ongoing process of creating incremental changes to products, services, processes or systems in order to enhance quality, increase efficiency and minimise cost. In manufacturing it is not a project with an end date – it is a routine: observe what actually happens on the line, find the biggest loss, change one thing, measure whether it worked, and standardise it if it did.
That routine is the PDCA cycle – Plan, Do, Check, Act – and it is where most improvement programmes break. Not at Plan, where ideas are never in short supply, but at Check. Without reliable production data nobody can prove the change made a difference, so the new standard never sticks and the loss quietly returns three months later.
Continuous improvement software closes that loop. It records what every machine did, second by second, categorises every stop and every defect, and shows the before-and-after of each change in numbers that operations, quality and finance all accept. The methodology stays yours; what changes is that you can finally see whether it is working.

Key continuous improvement methodologies
Lean & Kaizen
Lean Manufacturing – eliminate the eight wastes and make value flow. Lean manufacturing software makes waste visible in hours rather than during an annual value-stream workshop.
Kaizen – small improvements, made continuously, by the people doing the work. Kaizen software captures the idea, the action and the measured result, so gains are not lost at shift handover.
5S & Value Stream Mapping – a disciplined workplace and a mapped flow. Digital audits and real cycle-time data replace the clipboard walk and the stopwatch estimate.
Six Sigma & structured problem solving
Six Sigma – reduce variation until defects become statistically rare. SPC and Shewhart control charts built from live process values show drift long before it becomes scrap.
DMAIC – Define, Measure, Analyse, Improve, Control. The Measure and Control phases are only ever as good as the measurement system standing behind them.
PDCA & Root Cause Analysis – the improvement loop itself, with 5 Whys and fishbone work grounded in the actual event log rather than in what people remember about last Tuesday.
Equipment & shop-floor routines
OEE – Availability x Performance x Quality: the single number that shows how much of your theoretical capacity is actually being converted into good product.
TPM – Total Productive Maintenance moves ownership of equipment condition onto the line, supported by autonomous maintenance checklists and reliability data.
Gemba walks & Andon – go and see, and let the line call for help the moment it needs it. Digital Andon routes the call and records how long the response took.
Continuous improvement on a whiteboard vs continuous improvement on data
Most improvement programmes run on a hand-written downtime log, a shift report typed up the following morning and a spreadsheet nobody fully trusts. Short stops are never recorded at all, causes are assigned from memory hours after the event, and the effect of last month’s change is impossible to isolate from everything else that happened.
With machine data flowing automatically, the loss is on screen while the shift is still running. The improvement team argues about the fix instead of about whether the number is right – and the Check step of PDCA takes minutes rather than a month.
Improving without a system:
- Downtime written down by hand - microstops and reduced speed are never captured at all
- Root causes assigned from memory at the end of the shift, not at the moment of the stop
- Kaizen ideas and actions tracked in spreadsheets, lost at handover and again at year end
- No credible before-and-after, so changes that worked never become the new standard
Improving with continuous improvement software:
- Every stop captured automatically from the PLC, down to microstops of a few seconds
- Losses categorised and ranked for you, with Pareto charts and an OEE loss tree
- Actions, owners and deadlines tracked against the specific loss they were meant to remove
- Measured before-and-after on OEE, scrap and cycle time - proof the change actually worked
~10%
typical OEE gain on connected production lines
5 s
shortest microstop detected automatically
-30%
less time spent on manual production reporting
24/7
live visibility of every line, shift and site
Accevo continuous improvement tools
Six modules that give an improvement team the three things a whiteboard cannot: data it can trust, standards people actually follow, and proof that the change worked. Each runs on the one Accevo Smart Factory platform, so you can start with a single bottleneck line and add capability – up to a full Sistema di esecuzione della produzione – without replacing what you already run.
A built-in industrial data historian that records time-series data from PLCs, sensors, SCADA systems and manual entry in one archive. Trend any process parameter against output, energy or quality over any period – the analytical backbone for Six Sigma and root cause analysis.
Detects the short, repeated interruptions no operator would ever write down, measures them precisely and locates the bottleneck causing them. On fast packaging and assembly lines this is usually the single largest hidden loss in the plant.
Replaces forms and binders with digital documents and step-by-step operator guidance. The standard is delivered at the panel in the context of the current order, followed in sequence, and updated everywhere at once the moment it changes.
Samples, tests and results managed digitally and tied back to the batch, machine and shift that produced them. Lab data stops being an island: an out-of-spec result points straight at the process conditions behind it.
Uploads programs, recipes and setpoints to machines automatically. Cuts launch and changeover time, and removes the setting errors that quietly generate scrap for the first hour of every run.
Turns the shift whiteboard into a touchscreen dashboard fed by live data. Daily management, SQCDP boards and Gemba reviews all run on the numbers the line is producing right now, and actions are captured in the room.
OEE improvement: find the loss before you try to fix it
OEE – Availability x Performance x Quality – is the most useful single number in continuous improvement and the most commonly misused. A monthly OEE figure calculated from operator logs tells you the plant lost time. It does not tell you where, when, or to what. Accevo calculates OEE continuously from machine signals and keeps breaking it apart until every lost minute has a name and an owner.
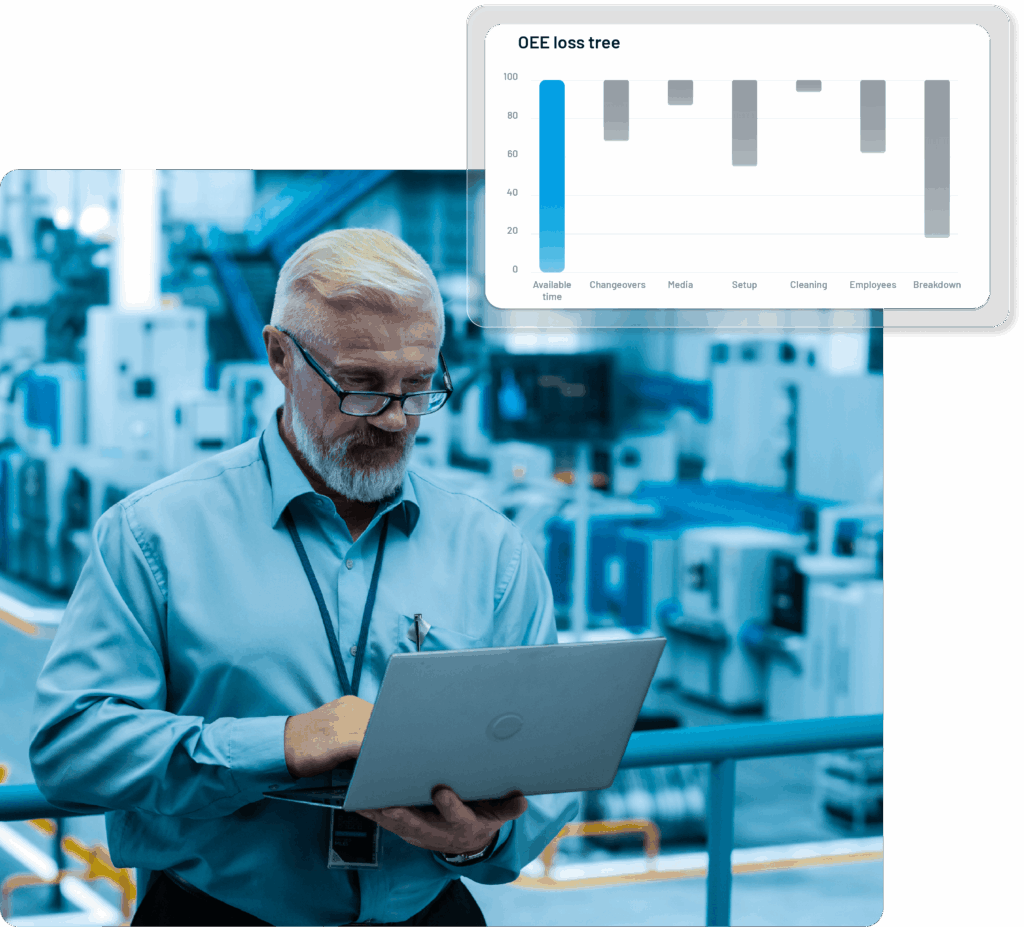
Availability, Performance and Quality, calculated live
Machine states, cycle counts and reject counts come straight from the controller, so all three factors are computed as production runs – per machine, per shift, per product, per crew. No end-of-shift reconstruction, no rounding, and no argument about the baseline before the improvement even starts.
The Six Big Losses and the OEE loss tree
Every lost minute lands on a loss tree: breakdowns and setups under Availability, microstops and reduced speed under Performance, scrap and rework under Quality. Pareto charts rank the causes by cost, so the improvement team works on the biggest loss rather than the loudest one.
Benchmarking across lines, shifts and sites
The same product on two lines, or the same line on two shifts, rarely performs the same. Comparable OEE across assets makes that gap visible and turns your own best-performing shift into the standard everyone else can be held to.
Microstops and downtime analysis
A five-second stop is invisible. Two hundred of them in a shift is an hour of lost production that appears in no report at all. Microstops are the classic hidden loss – too short to log by hand, too frequent to ignore, and almost always the reason a line runs below rated speed while the downtime board looks perfectly clean.
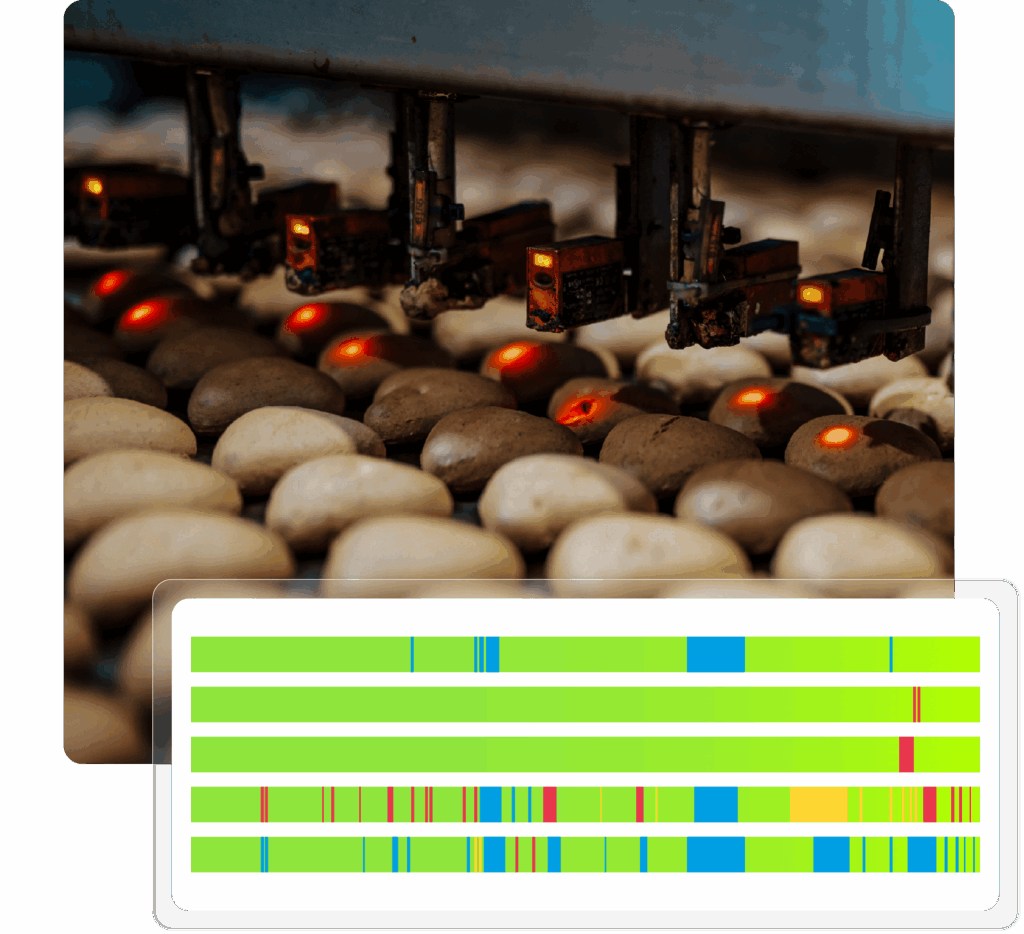
Automatic detection at the source
Stops are read directly from PLC signals – Siemens, Allen-Bradley, Mitsubishi, OPC UA, Modbus TCP – and timestamped to the second. Nothing depends on an operator noticing, remembering or having a free hand.
Root cause, not just a stop log
Repeated stops are grouped and correlated across machines, shifts, products and time of day, so the pattern behind them surfaces: a specific format change, a particular material lot, the third hour of the night shift.
Pareto ranking and action tracking
Causes are ranked by total minutes lost and turned into a prioritised improvement list, with an owner and a deadline attached – and the effect re-measured once the fix is in place.
Paperless production and digital documentation
Continuous improvement produces standards, and a standard that lives in a binder is a standard nobody follows. Going senza carta is what makes an improvement stick: the new method reaches every operator on every shift the moment it is approved, and the system records that it was actually followed.

Digital SOPs and work instructions
Procedures, drawings, photos and video delivered at the operator panel in the context of the current order. Update once and the previous revision disappears from the shop floor immediately.
Electronic forms and checklists
Setup checks, changeover records, cleaning logs, autonomous maintenance rounds and start-up approvals completed on screen, with every value validated against its limits as it is entered.
Digital 5S and Gemba audits
Audit templates completed on a tablet during the walk, with photo evidence attached, scores trended over time and findings converted straight into tracked improvement actions.
Deviations, actions and CAPA
Every deviation, idea and corrective action carries an owner, a due date and a verified outcome – the audit trail your improvement programme needs to prove that it works.
Real-time monitoring: see the loss while you can still fix it
Improvement that arrives with tomorrow’s report is history, not management. Accevo shows every line’s current state, rate and OEE as it happens – on the operator panel, on shop-floor screens and in the daily meeting – so a slowdown becomes a decision within minutes instead of a discussion next week.
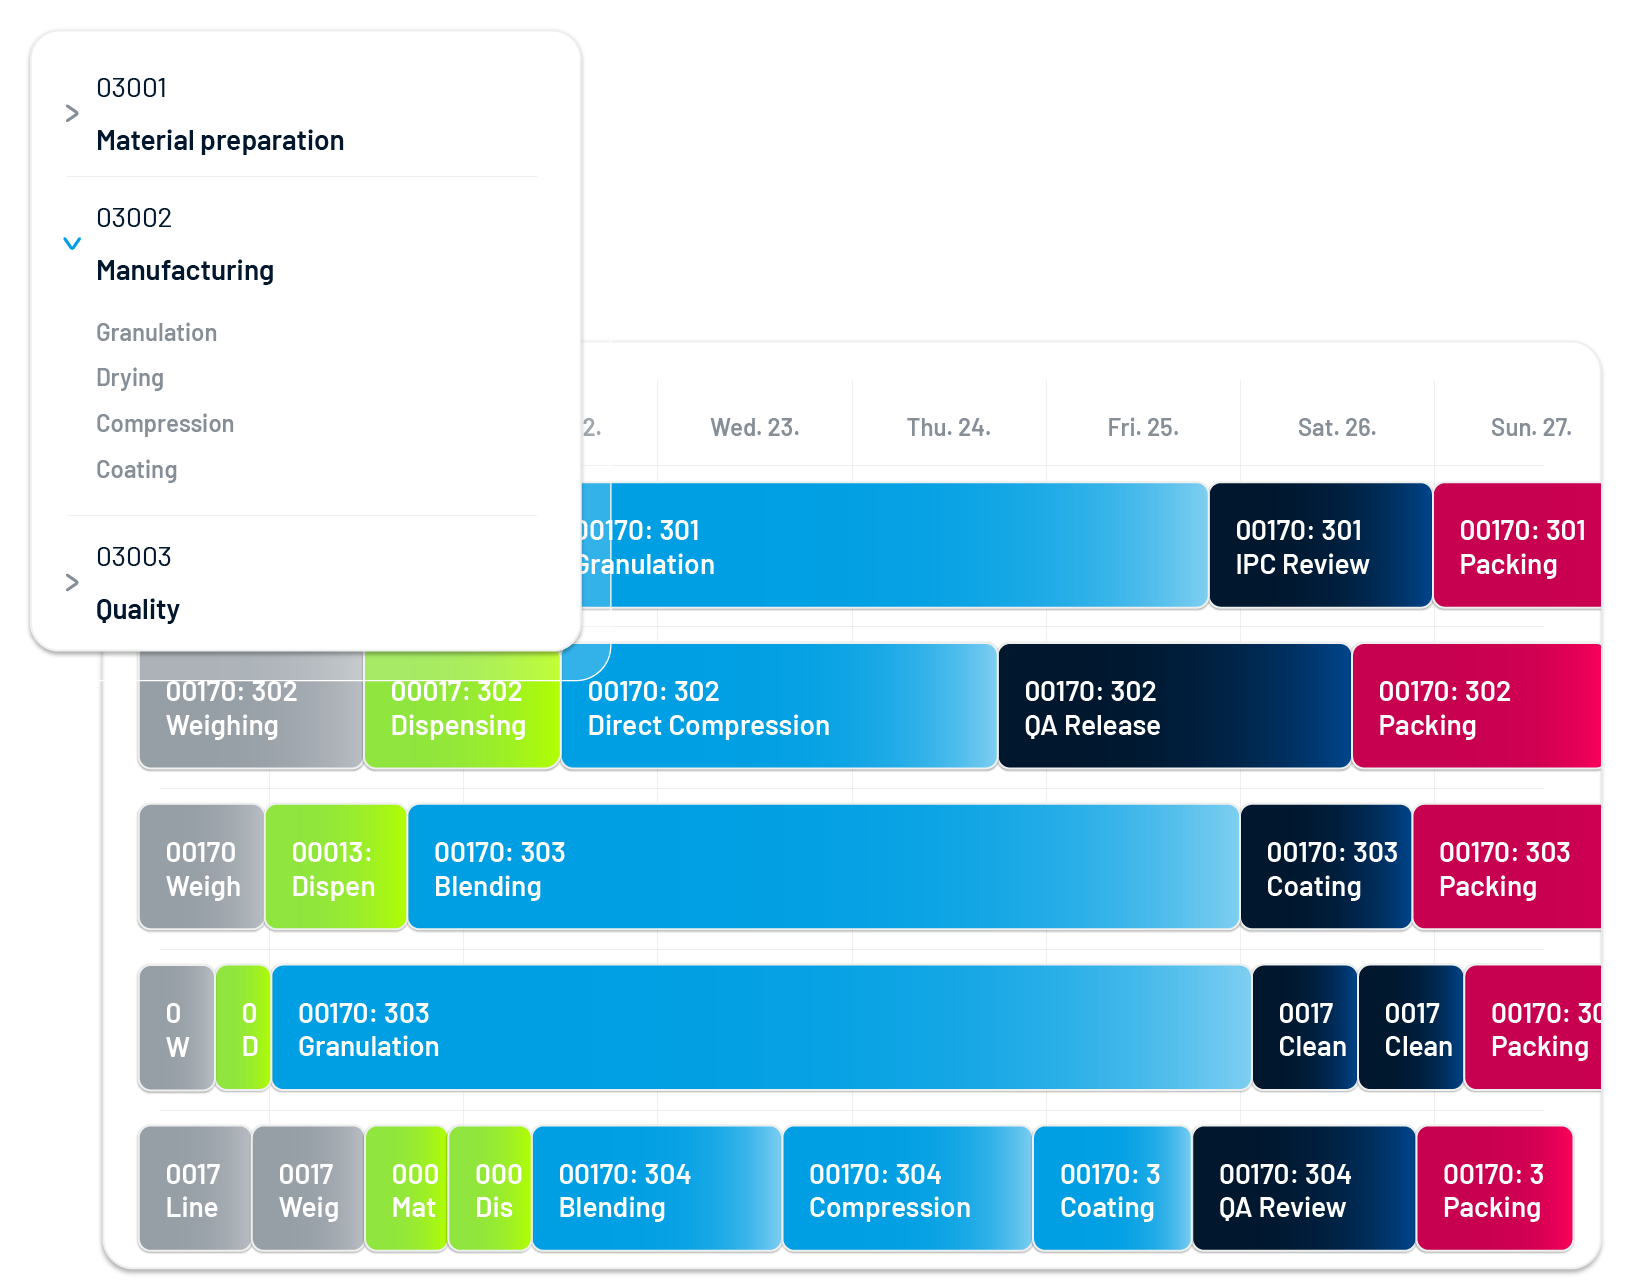
Live dashboards on the floor
Large-screen visualisation of output against target, current status and OEE for every line and every shift.
Automatic alerts and Andon
Email, SMS and panel alerts triggered by machine signals the moment a line drops below its threshold.
Interactive daily meetings
Digital SQCDP and shift boards fed by live data, with improvement actions captured during the meeting.
Continuous improvement software for every role

Responsabile di produzione
See which line is behind target and why, on the shift that is running now. Automatic alerts when OEE drops below threshold mean you act during the run rather than at the post-mortem.

Responsabile del miglioramento continuo
Stop rebuilding the baseline before every event. Stops, defects and speed losses are already captured, categorised and ranked, so a Kaizen week starts with the top three losses instead of a week of data collection – and ends with a result you can defend.

Direttore di stabilimento / VP Operazioni
Comparable KPIs across lines, shifts and sites, with the improvement portfolio and its verified savings in a single view – the evidence base for your next capacity or automation decision.
Start with one line. Prove the gain. Then scale.
You do not need a plant-wide programme to begin. Connect one bottleneck line, run it for a fortnight and let the data show where the capacity is actually going. Most sites find enough hidden loss in those first two weeks to justify the next step – and because every module runs on the same platform, extending to more lines, more sites or full MES is configuration rather than a new project.

Contatto con il nostro esperto
Piotr Kańka, Esperto di software industriale
- Incontro online di 60 minutiti con uno specialista dedicato che presenta un sistema top di un settore simile
- Modellazione dal vivo del vostro processo produttivo
- Preventivo dopo l'incontro
Domande frequenti
Continuous improvement in manufacturing, explained
Continuous improvement is the ongoing practice of making incremental changes to products, processes and systems in order to raise quality, increase efficiency and reduce cost. In manufacturing it runs as a repeating loop - observe, measure, change, verify, standardise - rather than as a one-off project with a closing date.
Continuous improvement software collects production data automatically from machines and operators, quantifies the losses it finds, and manages the improvement actions taken against them. It provides the measurement layer that Lean, Kaizen, Six Sigma and PDCA all depend on, and it shows whether each change actually delivered the gain that was expected of it.
Lean manufacturing focuses on removing waste and improving flow. Kaizen is the practice of small, continuous improvements made by the people doing the work. Six Sigma is a statistical approach to reducing process variation and defects, usually structured as DMAIC. Most plants combine all three - they differ in method, not in goal.
Plan using ranked losses instead of opinions. Do the change on a defined line and product. Check by comparing OEE, scrap and cycle time before and after on the same measurement basis. Act by writing the new method into the digital work instruction so every shift receives it. Check is where manual programmes fail, and where automatic data collection makes the difference.
OEE (Overall Equipment Effectiveness) is Availability x Performance x Quality - the share of theoretical capacity converted into good product. It matters because it decomposes: a falling OEE can always be traced to a specific loss category, which gives the improvement team a prioritised, costed target list instead of a general instruction to do better.
Microstops are interruptions too short to be logged by hand, often only a few seconds. They rarely appear in downtime reports, yet on fast packaging and assembly lines they are frequently the largest single loss. Detecting them automatically typically uncovers hours of capacity per week that nobody knew they were losing.
Measurement Explorer (MEX) as a data historian, microstops and downtime analysis, OEE and performance analytics, paperless production with digital SOPs and checklists, quality and LIMS data, machine control for changeovers, and interactive meeting boards. All of them share one data model on the Accevo Smart Factory platform.
No. Accevo modules connect to machines directly and integrate with existing ERP, MES, QMS and CMMS systems through web services (REST, SOAP), SAP RFC, intermediate databases or flat files. Most plants start with one line and one module, then expand.
Machine connectivity and live OEE dashboards can be running within days on standard PLC protocols. The first measurable improvements usually come from microstop and changeover losses that become visible in the opening weeks, well before any capital investment is required.
FMCG and food, pharmaceutical and life sciences, tobacco, and discrete manufacturing - anywhere output depends on equipment performance, changeover discipline and documented standards.
Articoli correlati

Ottimizzare l'efficienza della fabbrica: Guida alla selezione e all'implementazione di quadri decisionali per i processi produttivi
In today’s competitive business landscape, effective decision-making is crucial to the success of any organization. In the manufacturing sector, efficient decision-making frameworks can greatly impact the overall production process. This article will explore various decision-making frameworks and provide guidance on how to choose and implement the most suitable one for

Benefit Tracker - Trasformare l'implementazione in un successo misurabile
Benefit Tracker: Cost Savings Tracking Software for Manufacturing The true value of a manufacturing software investment is measured after go-live. Benefit Tracker sets the baseline before anything changes, tracks the KPIs that actually move, and produces a verified number your finance team will sign off on. Book a Consultation 15-30%

In che modo Accevo Smart Factory supporta la Lean Manufacturing?
Lean manufacturing is a production process that is based on the concept of maximizing productivity while minimizing waste within manufacturing. During the course of this process, actions are taken to further improve production. According to the Lean principle, anything that does not add value to a product that customers are