

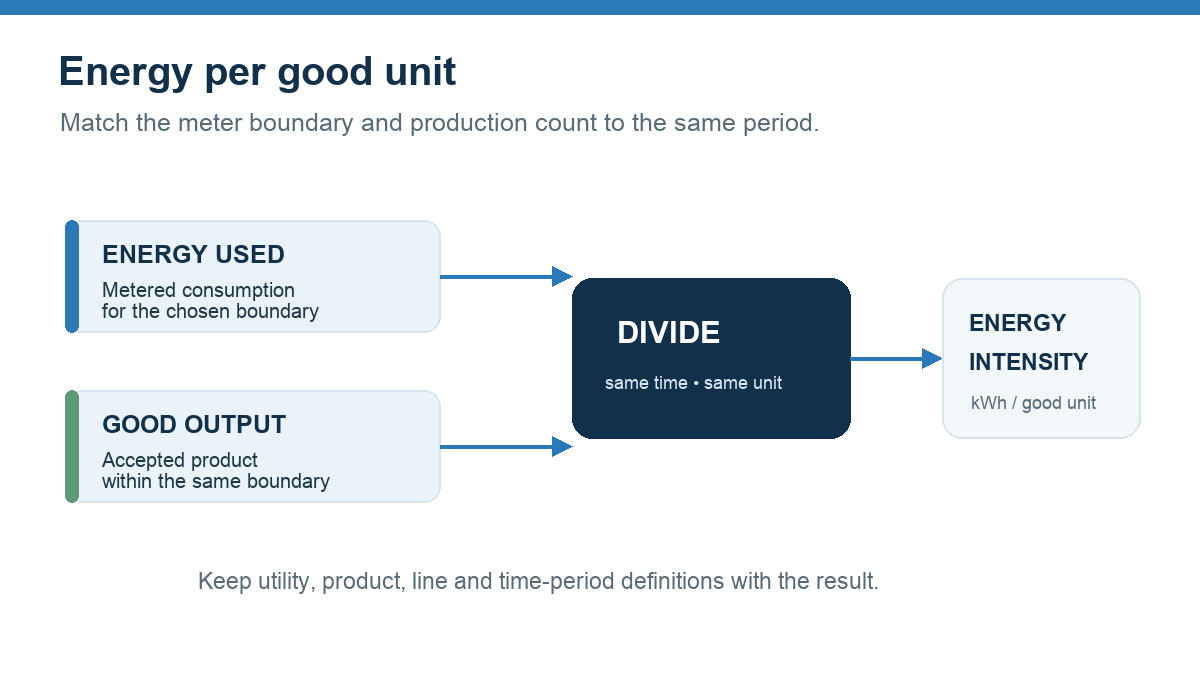
Energy per good unit compares utility consumption with accepted production output over the same time period and measurement boundary. This manufacturing energy efficiency measure helps a team see whether a change in total consumption reflects a change in output or a change in energy use per product.

Calculate energy per good unit
For one utility and one defined production boundary, divide energy consumed by the number of good units produced in the same interval:
Energy intensity = energy consumed ÷ good production output
For example, a team might express electricity as kilowatt-hours per good case, compressed air as cubic metres per good unit, or gas as kilowatt-hours per tonne of saleable product. The unit should fit the process. The U.S. Department of Energy describes a simple energy-intensity indicator as energy consumption divided by productive output for the organization, facility, process, equipment or other defined boundary in its manufacturing energy management guide.
Use good output when the question concerns the energy required for saleable production. If your process counts total output, including rejects or held product, label that metric separately. State the denominator in the name of the measure, such as “kWh per accepted case,” so teams can interpret it without guessing.
Why total consumption can give the wrong signal
Total energy often rises when a plant runs more hours or makes more product. That does not by itself show whether the process became less efficient. Energy per good unit adds the output context. It can also move in the wrong direction while total consumption falls if output drops faster than energy use.
Compare like with like. Product mix, line speed, start-ups, cleaning, idle time and operating schedules can affect the ratio. A single site-wide figure may hide a change on one line or for one product. Choose a level that supports a real decision and keep the boundary stable across the periods you compare.
Illustrative calculation
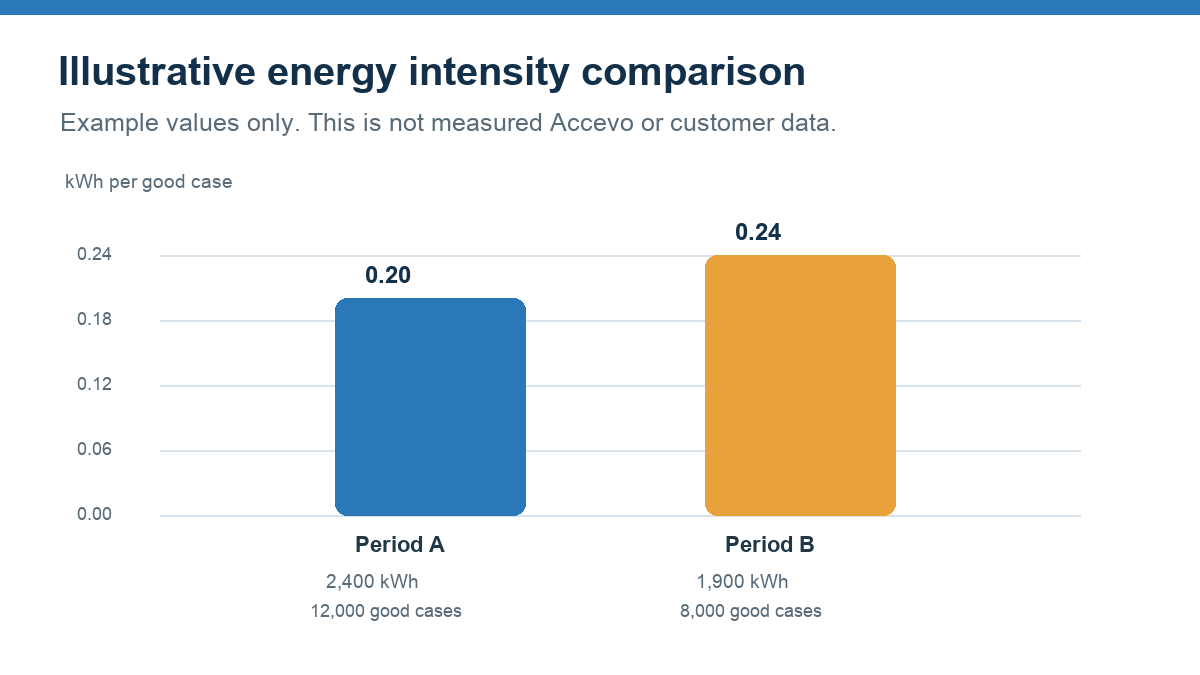
The chart uses invented values for explanation, not measured Accevo or customer data. In Period A, 2,400 kWh divided by 12,000 good cases equals 0.20 kWh per case. In Period B, 1,900 kWh divided by 8,000 cases equals 0.2375, rounded to 0.24 kWh per case. Total energy fell, while energy per good case rose. A production team would need to investigate the cause before drawing a conclusion.
Match the meter and production records
- Choose the numerator: name the utility, meter or meter group. Keep electricity, gas, steam, water and compressed air as separate measures unless a documented conversion method supports a combined indicator.
- Choose the denominator: select accepted cases, kilograms, litres, batches or another unit that reflects the process output.
- Set one time window: use the same start, end, time zone and aggregation interval for energy and production counts.
- Check the boundary: confirm the meter covers the equipment and period represented by the output count. Account for shared utilities and overlapping meters.
- Keep exceptions visible: note missing meter reads, counter resets, rejected output, holds and non-production periods instead of silently filling gaps.
If one meter serves several lines, do not assign all its energy to one product without a transparent allocation rule. If the site has only a building or area meter, report intensity at that level or state the assumptions behind any lower-level allocation.
Use normalization carefully
A ratio does not remove every operating difference. A product that needs a longer cycle or a different process temperature may use more energy per unit for a valid reason. Compare the same product and process where possible. If you compare products, sites or lines with different conditions, explain the normalization method and retain the raw totals beside the normalized figure.
Small output periods can make the ratio unstable. A short test run, start-up or maintenance window may not represent a normal production period. Set a minimum window that fits the process, then review exceptional runs separately instead of blending them into a routine baseline.
Turn a change in intensity into an investigation
- Check meter completeness, units, timestamps and counter behavior.
- Confirm that good-output counts cover the same line, product and interval.
- Review production hours, idle periods, changeovers and product mix.
- Look at the utility and process data that can explain the difference.
- Record the cause, action and follow-up period so the team can check whether the change persisted.
An energy ratio signals where to look; it does not prove the cause or the savings. For the metering and production context behind the calculation, read the guide to energy monitoring systems in manufacturing e il energy management system explainer. Accevo’s Software per sistemi di gestione energetica e industrial data historian pages describe related production-data capabilities.
Energy per good unit questions
Is energy per good unit the same as energy intensity?
It is one form of energy intensity: energy consumption divided by a defined productive output. The measure only makes sense when its utility, output unit, time period and boundary are clear.
Should I use total output or good output?
Use good output when you want energy per accepted product. You can track energy per total output for a different operational question, but label the metric and keep reject handling consistent.
Can I add electricity and compressed-air consumption together?
Keep different utilities separate unless you use a documented conversion basis. A combined number can hide different units, energy content and measurement boundaries.
How often should a manufacturer calculate the measure?
Use the shortest interval supported by reliable meters and production counts for the decision at hand. Validate the data at that interval before comparing shifts, products or lines.
