

To calculate OEE for pharmaceutical batch processes, define the equipment boundary, planned production time, run events, expected output rate and good output for the product being measured. Then calculate Availability × Performance × Quality using one set of rules across shifts and campaigns.
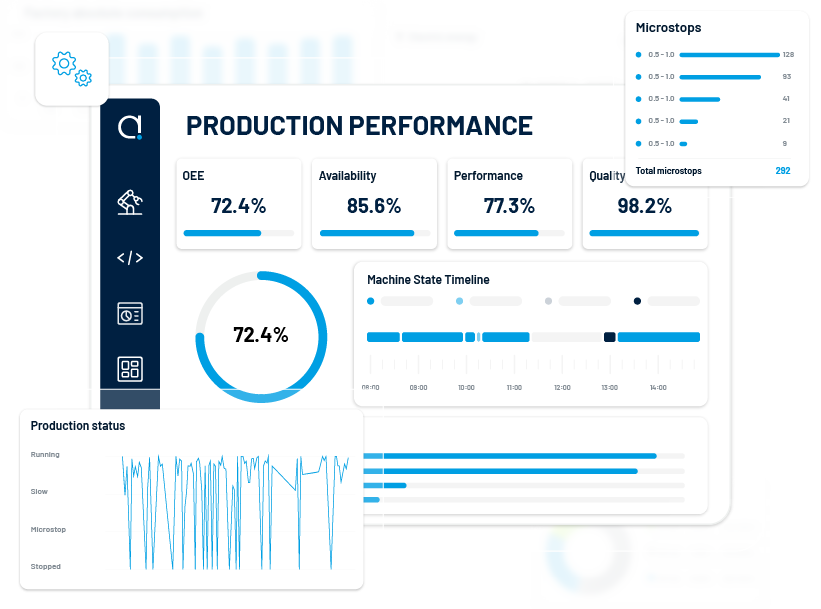
The OEE formula
OEE = Availability × Performance × Quality
- Availability = Run Time ÷ Planned Production Time
- Performance = Actual Total Output ÷ Theoretical Output at the approved ideal rate
- Quality = Good Output ÷ Total Output
The multiplication combines three ratios, as described in the OEE factors guide. A useful calculation also preserves the underlying time, quantity and loss data so your team can investigate the causes.
Define the batch-process boundary first
A tablet press, granulator, fluid bed dryer, mixer and packaging line each have different start and stop events. State which asset or process stage the OEE number represents. If a batch moves through several pieces of equipment, do not combine their production times into one percentage unless the measurement method accounts for the process flow.
Agree on what counts as planned production time. Record planned breaks, maintenance, changeovers, cleaning and campaign transitions according to the site’s written definitions. Plants may classify some of these periods differently. Consistency matters because changing the denominator can move Availability without changing equipment performance.
For a batch asset, define when the unit becomes available, when production begins, what counts as a stop, and what closes the run. Use the process schedule and equipment state to establish the time window. Keep reasons such as breakdown, setup, waiting for material, process hold and cleaning distinct when the data supports those categories.
Use an approved ideal rate for each product
Performance needs a product-specific rate or cycle standard that reflects the equipment and the process step. A mixer may use kilograms per minute; a tablet press may use tablets per minute; a batch reactor may use a validated cycle-time standard. Document the source and owner of each ideal rate.
Do not compare products with different recipes or operating windows against one generic speed. If the process does not have a stable rate, agree on a suitable time or output basis with process engineering and quality before publishing an OEE comparison.

Worked example: a tablet compression run
The following values are illustrative. They show the arithmetic; use your own approved production records and rate standards.
- Planned production time: 420 minutes
- Run time: 336 minutes
- Actual output: 378,000 tablets
- Theoretical output at the product’s ideal rate: 420,000 tablets
- Good output: 359,100 tablets
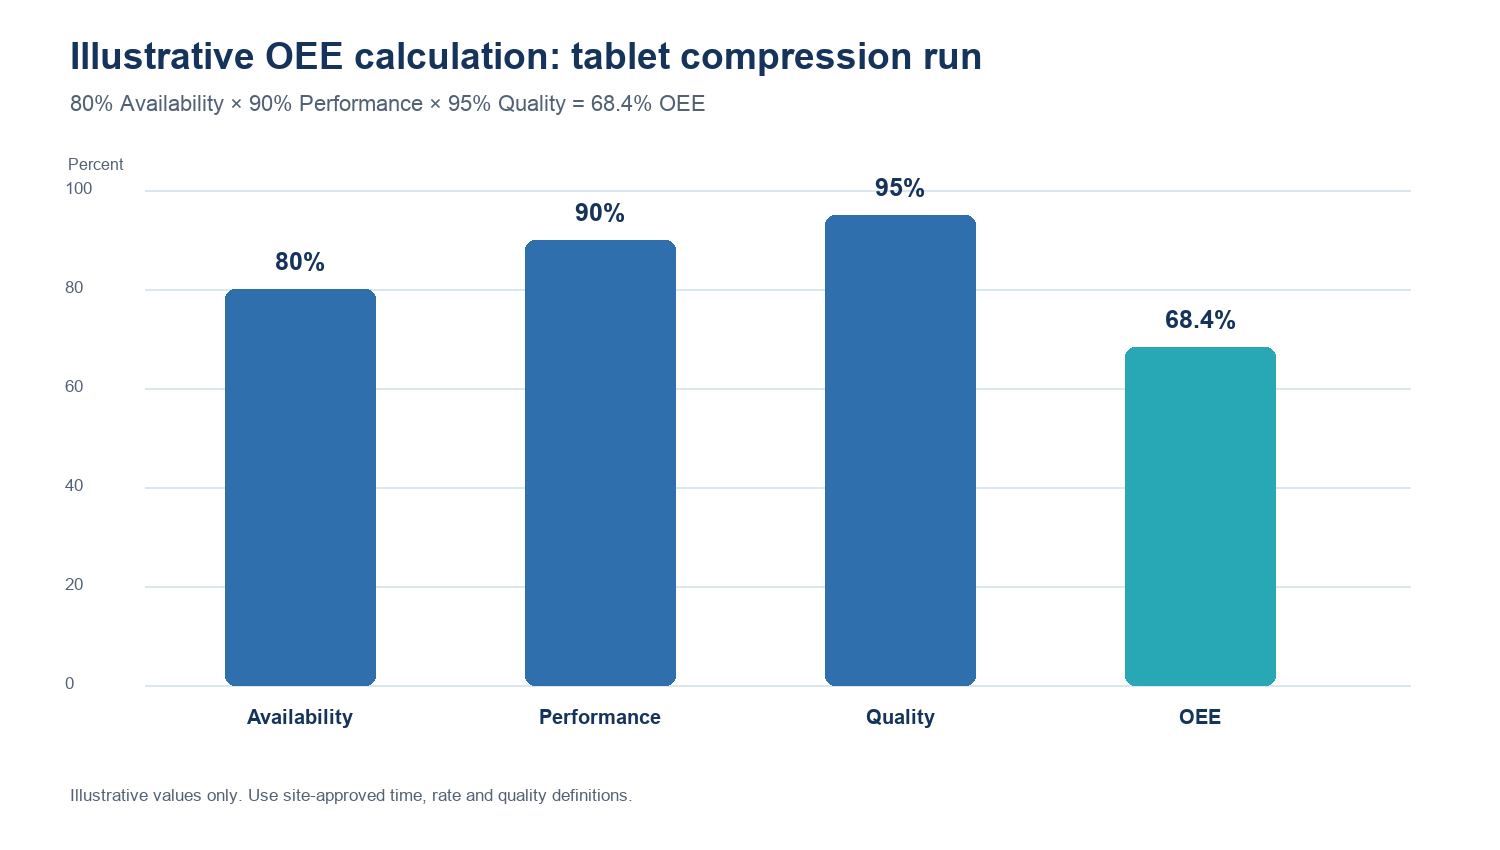
Availability: 336 ÷ 420 = 80%.
Performance: 378,000 ÷ 420,000 = 90%.
Quality: 359,100 ÷ 378,000 = 95%.
OEE: 80% × 90% × 95% = 68.4%.
How to read the result
The example’s largest loss sits in Availability, but the percentage does not explain the cause. Break down the 84 minutes outside run time by event: equipment fault, setup, wait for materials, planned process pause or another approved reason. Then compare by product, shift, asset and campaign only when each group uses the same definitions.
Check the source data before assigning an action. Missing run events can depress Availability. An outdated ideal rate can distort Performance. A product-specific good-output definition can change Quality. Ask engineering, production and quality to review the calculation rules together.
Batch-process choices that change the calculation
- Campaigns: decide how to treat transitions between batches and products.
- Long cycles: capture intermediate states when a single run spans several hours or shifts.
- Variable output: select a consistent unit such as kilograms, liters, tablets or completed batches.
- Rework and holds: define how the site records output that needs further processing or review.
- Multiple assets: measure each bottleneck stage before combining results across a process.
What counts as a good OEE in pharma?
There is no single OEE target that fits every pharmaceutical process. A target only helps when the plant defines the time basis, product mix, asset boundary, ideal rates and loss categories. Compare a line with its own baseline and operating context before using external benchmarks.
Start with consistent event data
Use machine signals where the equipment exposes reliable states, and give operators a short, controlled set of reason codes for events that need human context. Review the unclassified time each week. Correct the event model before asking teams to improve a percentage they cannot explain.
See Accevo’s OEE performance monitoring software, the OEE definition and its micro-stops monitoring page. For pharma execution and batch records, explore pharma manufacturing software.
OEE questions for pharmaceutical production teams
Can a plant calculate OEE for a batch process?
Yes, when the team defines the equipment boundary, production window, run states, rate standard and good-output rule. A batch process with long or variable cycles may need a time-based or process-quantity method that fits the equipment. Record the method with the result.
Should cleaning and changeover count as downtime?
Use the plant’s planned-production-time definition. Some sites exclude planned cleaning or changeover from the denominator; others include selected periods to expose capacity loss. Choose a rule, document it and apply it the same way across the assets you compare.
Does a higher OEE always mean a better batch outcome?
OEE describes equipment use against defined time, rate and quality rules. It does not replace measures for product quality, yield, cycle time, schedule adherence or compliance. Review the measures together so an OEE target does not encourage a team to run faster at the expense of process controls.
What unit should a batch plant use?
Choose a unit that matches the measured process step, such as kilograms, liters, tablets or completed batches. Keep the unit and ideal rate consistent for the product and asset. Do not add unlike outputs into one rate without a documented conversion method.
Keep the calculation rules with the dashboard
Write the equipment boundary, planned time, stop definitions, ideal rates and good-output rules next to the OEE report. When a product, recipe, schedule or machine changes, review whether those rules still fit. That context helps the next shift interpret a change in the percentage.
